2019 AAU Campus Climate Survey
Rice University Participation and Results
Executive Summary
Last spring, Rice University invited full-time undergraduate and graduate students to take the Association of American Universities (AAU) Campus Climate Survey on Sexual Assault and Misconduct. Rice was one of 33 institutions that participated in this effort. In addition to gathering important, up-to-date information about the health and welfare of our students, the university had four main goals in asking students to complete this survey:
- To gain a better understanding of the campus climate and to estimate the prevalence of sexual violence and other forms of sexual misconduct experienced by Rice students;
- To reinforce the university's commitment to fostering a safe environment free from sexual assault and harassment;
- To inform our efforts to improve sexual assault prevention, education and awareness programs, and to provide the best services to survivors of sexual assault; and
- To better understand these issues and the climate at Rice within the national context.
The AAU employed Westat, an independent social science research firm, to create and administer the survey. Westat collaborated with a team of experts and scholars from the AAU and universities. Additionally, a draft instrument, based on the 2015 AAU Campus Climate Survey, was submitted to the 33 participating universities, which were encouraged to provide feedback and input. At Rice, the Office of the Provost met with SA, GSA, and STRIVE representatives to review the draft survey and compile a set of questions and suggestions for submission to the AAU/Westat.
At the conclusion of the survey period, Westat created reports and data tables for each of the 33 participating institutions, as well as an aggregated report that combined data for all of the institutions. The tables containing Rice’s data, the full campus climate report for Rice, and the AAU’s aggregate report are posted here:
- Complete Rice University data tables from Westat (includes data tables for results from the survey)
- Full AAU Campus Climate Survey report for Rice (includes the 2019 survey instrument and Westat’s narrative description of Rice’s survey data)
- AAU’s aggregate Campus Climate Survey report (includes survey design and methodology, narrative and graphic analyses of aggregate data across the 33 participating institutions, and the survey instrument)
What follows below is a summary of some of the key results drawn from the report and data tables produced by Westat for Rice. As such, it does not represent all or the only conclusions that can be gleaned from a thorough review of the data. For those interested in more detailed findings, we encourage you to review the tables.
A final note: Rice had the highest response rate among the 33 participating institutions: 71.6% of Rice undergraduates and 63.8% of Rice graduate students participated in the survey. This compares very favorably to the average response rates of 20.4% for undergraduates and 24.5% for graduate students among the other 32 institutions participating in the survey.
Key Findings from the 2019 AAU Survey
Prevalence of Incidents of Nonconsensual Sexual Touching or Penetration
Rice’s data tables include three sets of tables on reports of incidents of nonconsensual sexual touching or penetration. Tables 3.1-3.6 concern only incidents involving physical force or inability to consent or stop what was happening. Tables 4.1-4.5 concern only incidents involving coercion or without active, ongoing voluntary agreement. The data in these sets of tables build to and are combined in Tables 4.6-4.9. Accordingly, we focus here on 4.6-4.9 because they employ the most expansive definition of nonconsensual sexual contact. Specifically, these tables show prevalence rates for the percent of students who experienced completed or attempted nonconsensual penetration or sexual touching through the four different tactics covered in the survey.
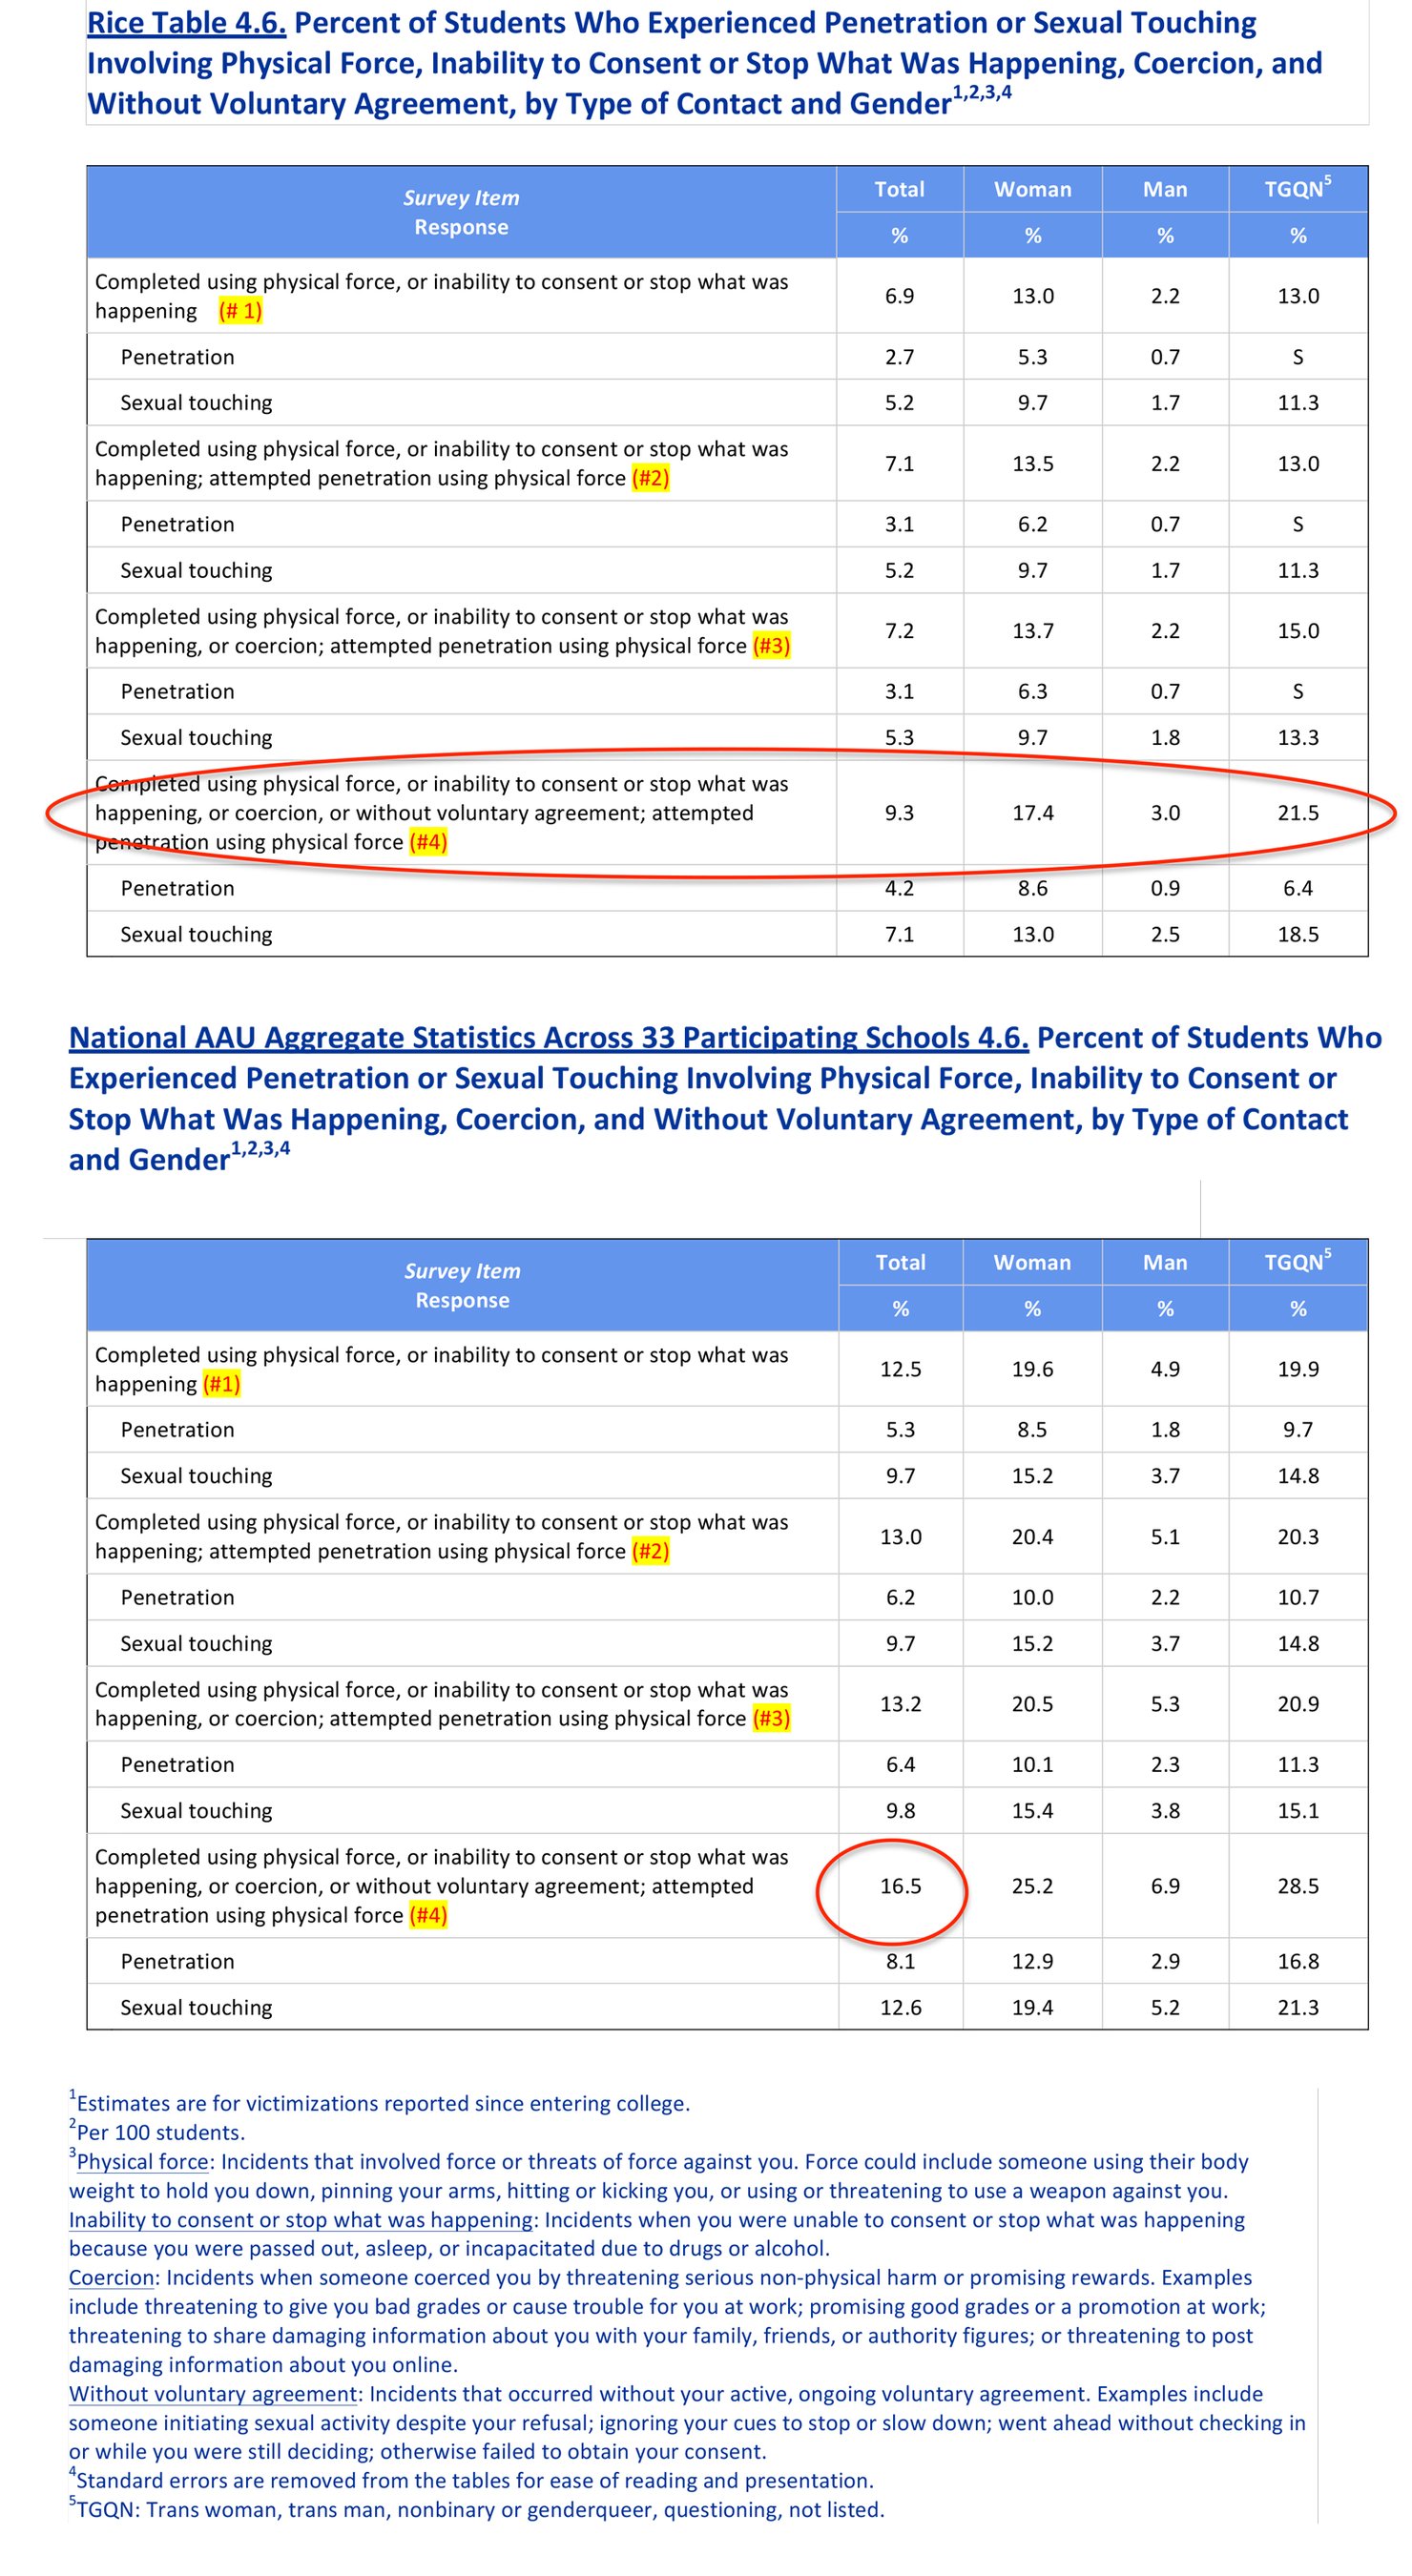
Table 4.6 shows, for all Rice students, four rows of data for nonconsensual penetration and nonconsensual touching. The rates were calculated for the period since respondents enrolled at Rice and are presented for all undergraduate and graduate students, and by gender - for women, for men, and for those who identify as transgender, nonbinary, genderqueer, questioning or did not list a gender identity, referred to as TGQN in the tables. Please note: Since only 59 responding students identified as TGQN, which is 1.3% of all respondents, not all tables show findings for this group since the sample sizes were too small for Westat to generate a reliable estimate. Also note that the information in Table 4.6 is cumulative, starting from the first row and then expanding the definition of nonconsensual penetration and nonconsensual sexual touching as you move down the table:
- # 1: Completed using physical force or threat of physical force, or inability to consent or stop what was happening.
- # 2: Adds “attempted penetration using physical force” to the estimate for # 1.
- # 3: Adds “completed using coercion” to the estimate for # 2.
- # 4: Adds “completed without voluntary agreement” to the estimate for # 3.
The next three tables show similar data, but restricted to different populations at Rice: undergraduate students (Table 4.7), graduate or professional students (Table 4.8) and undergraduate students in their fourth or higher year of study at Rice (Table 4.9). Below we list some key findings from these tables, and present, as reference in parentheses, how they compare to the national AAU data (that tallies across the 33 schools that participated in the study):
- Table 4.6 (all students): Overall, 9.3% Rice respondents reported experiencing at least one incident of nonconsensual sexual touching or penetration since enrolling at Rice University (comparison with AAU aggregate sample: 16.5%).
- This ranges from a low of 3.0% among men, to 17.4% among women, to 21.5% among TGQN students.
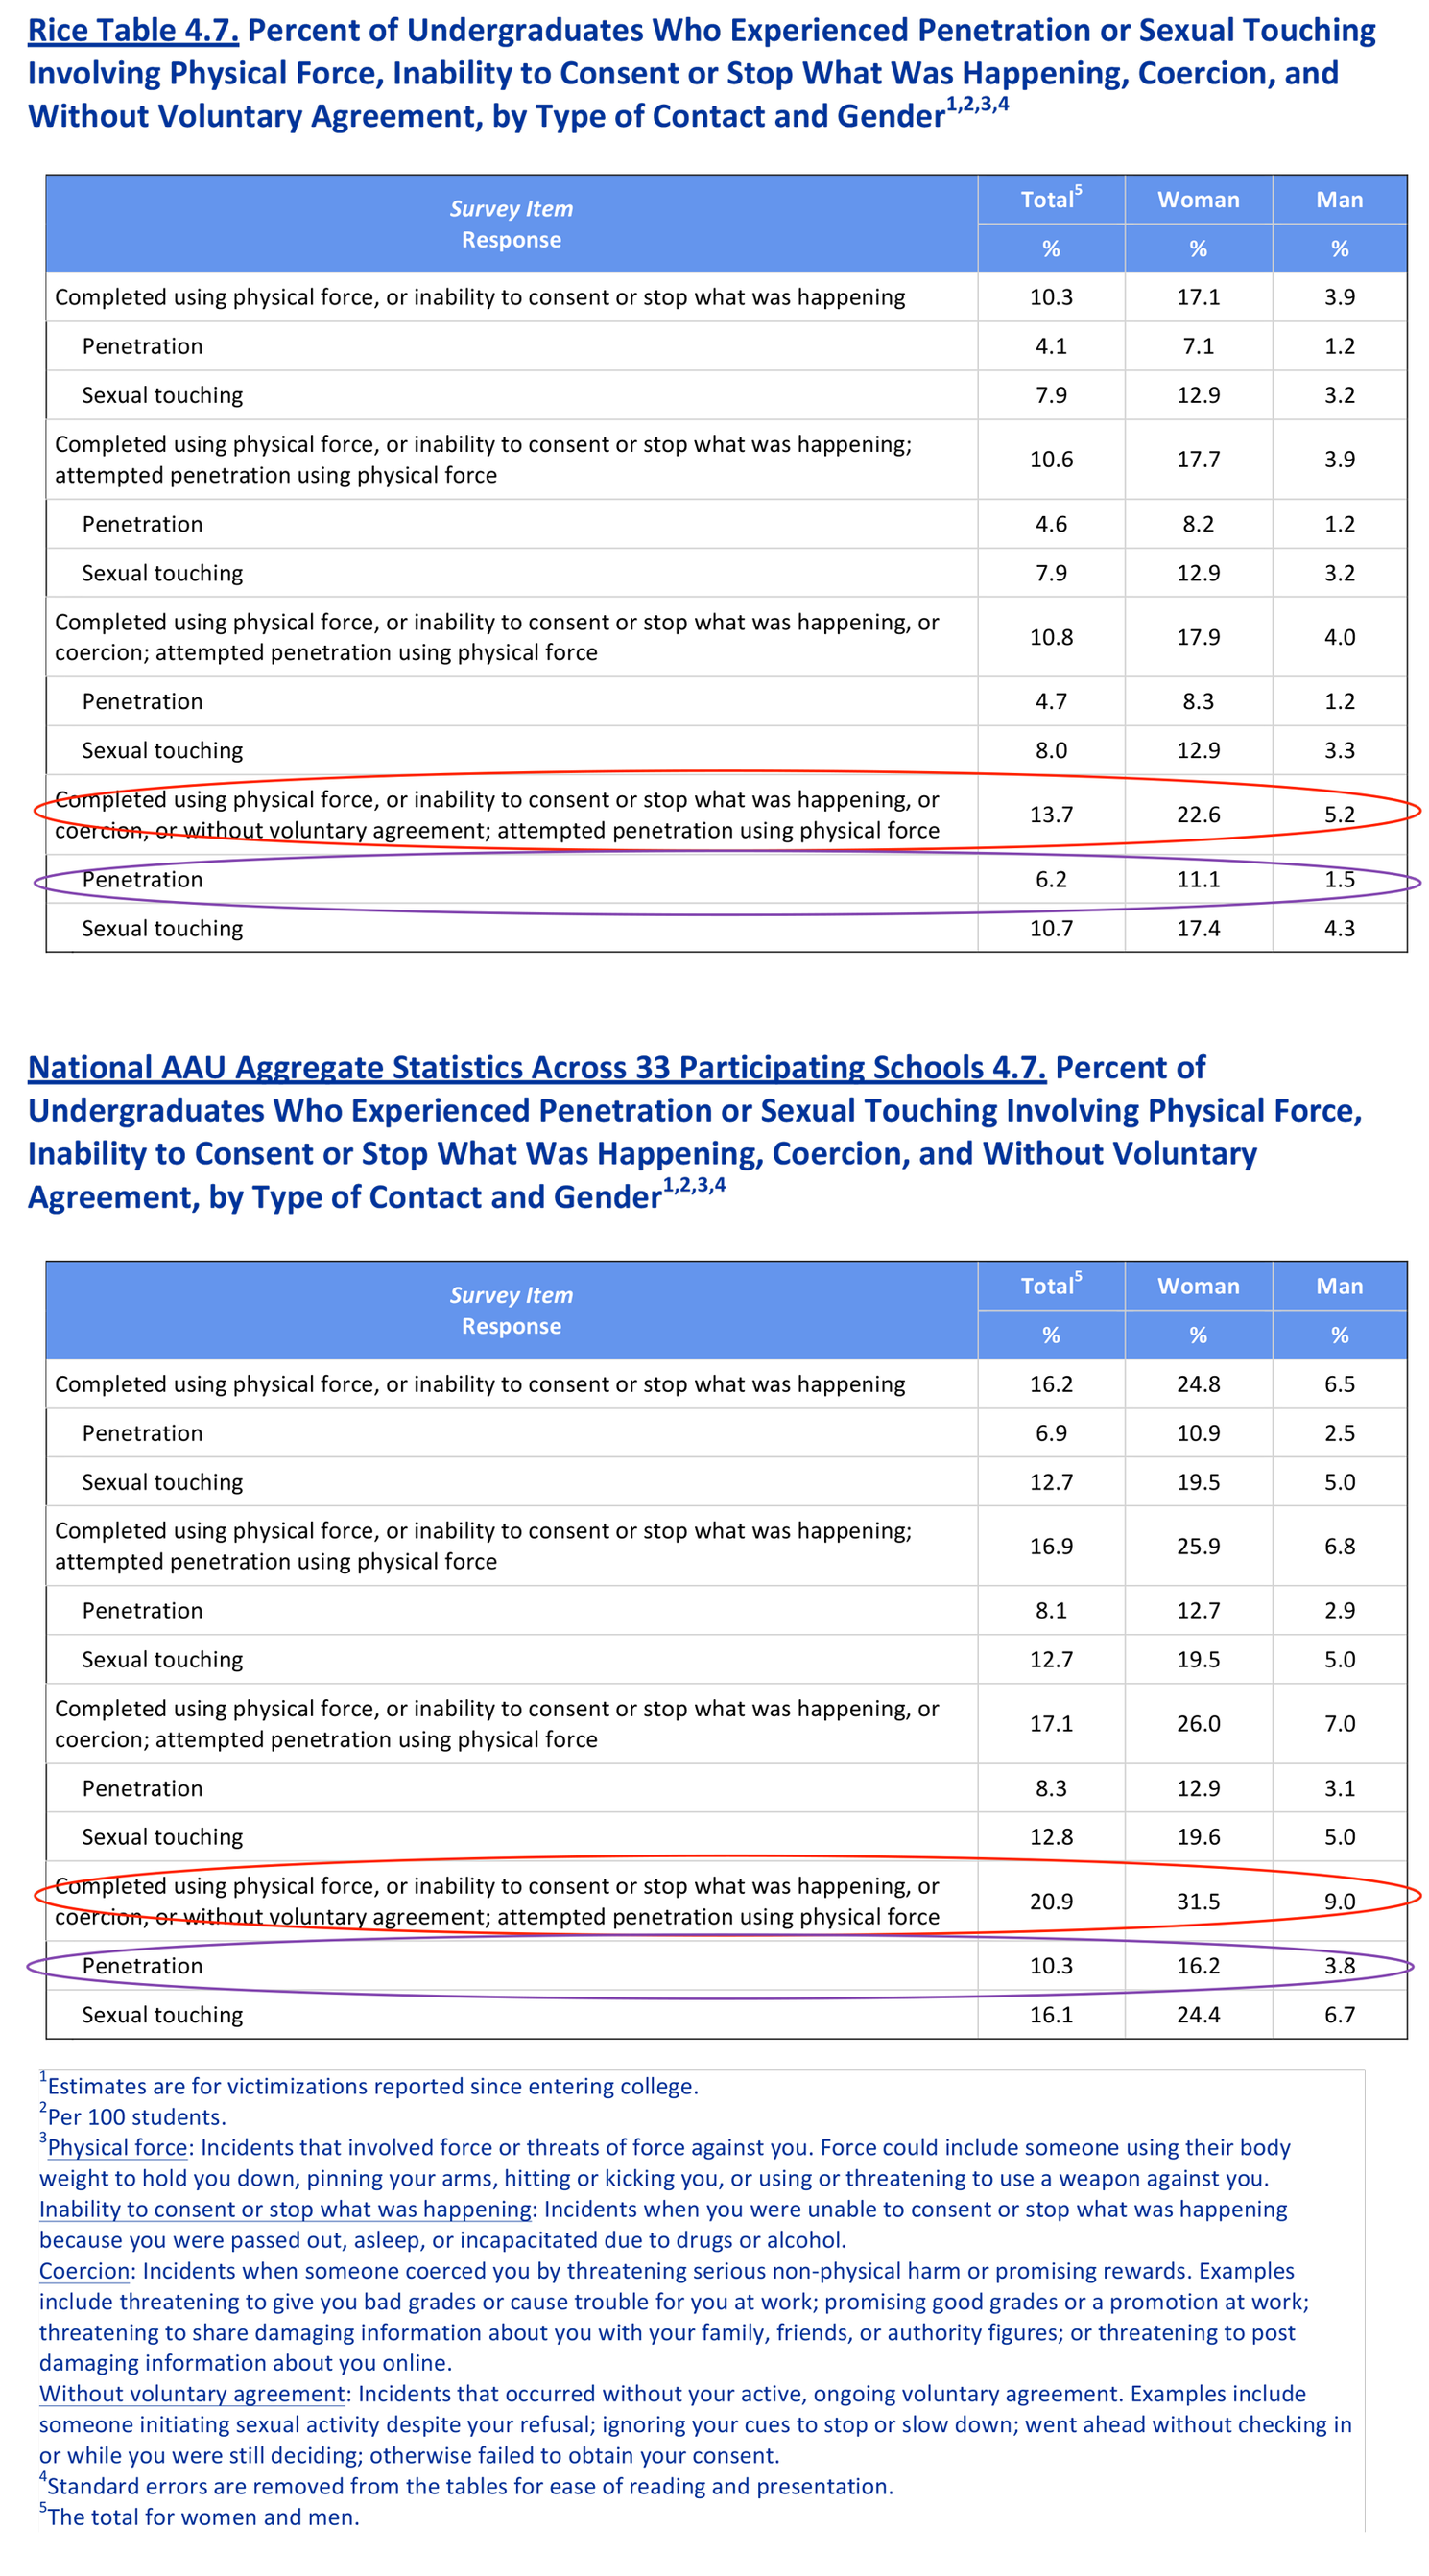
- Table 4.7 (undergraduate students only): Overall, 22.6% of undergraduate women and 5.2% of undergraduate men reported experiencing at least one incident of nonconsensual sexual touching or penetration since enrolling at Rice (comparison with AAU aggregate sample: 31.5% of undergraduate women, 9.0% of undergraduate men).
- Table 4.7 also shows 11.1% of undergraduate women and 1.5% of undergraduate men reported an incident of nonconsensual penetration since enrolling at Rice (comparison with AAU aggregate sample: 16.2% of undergraduate women, 3.8% of undergraduate men).
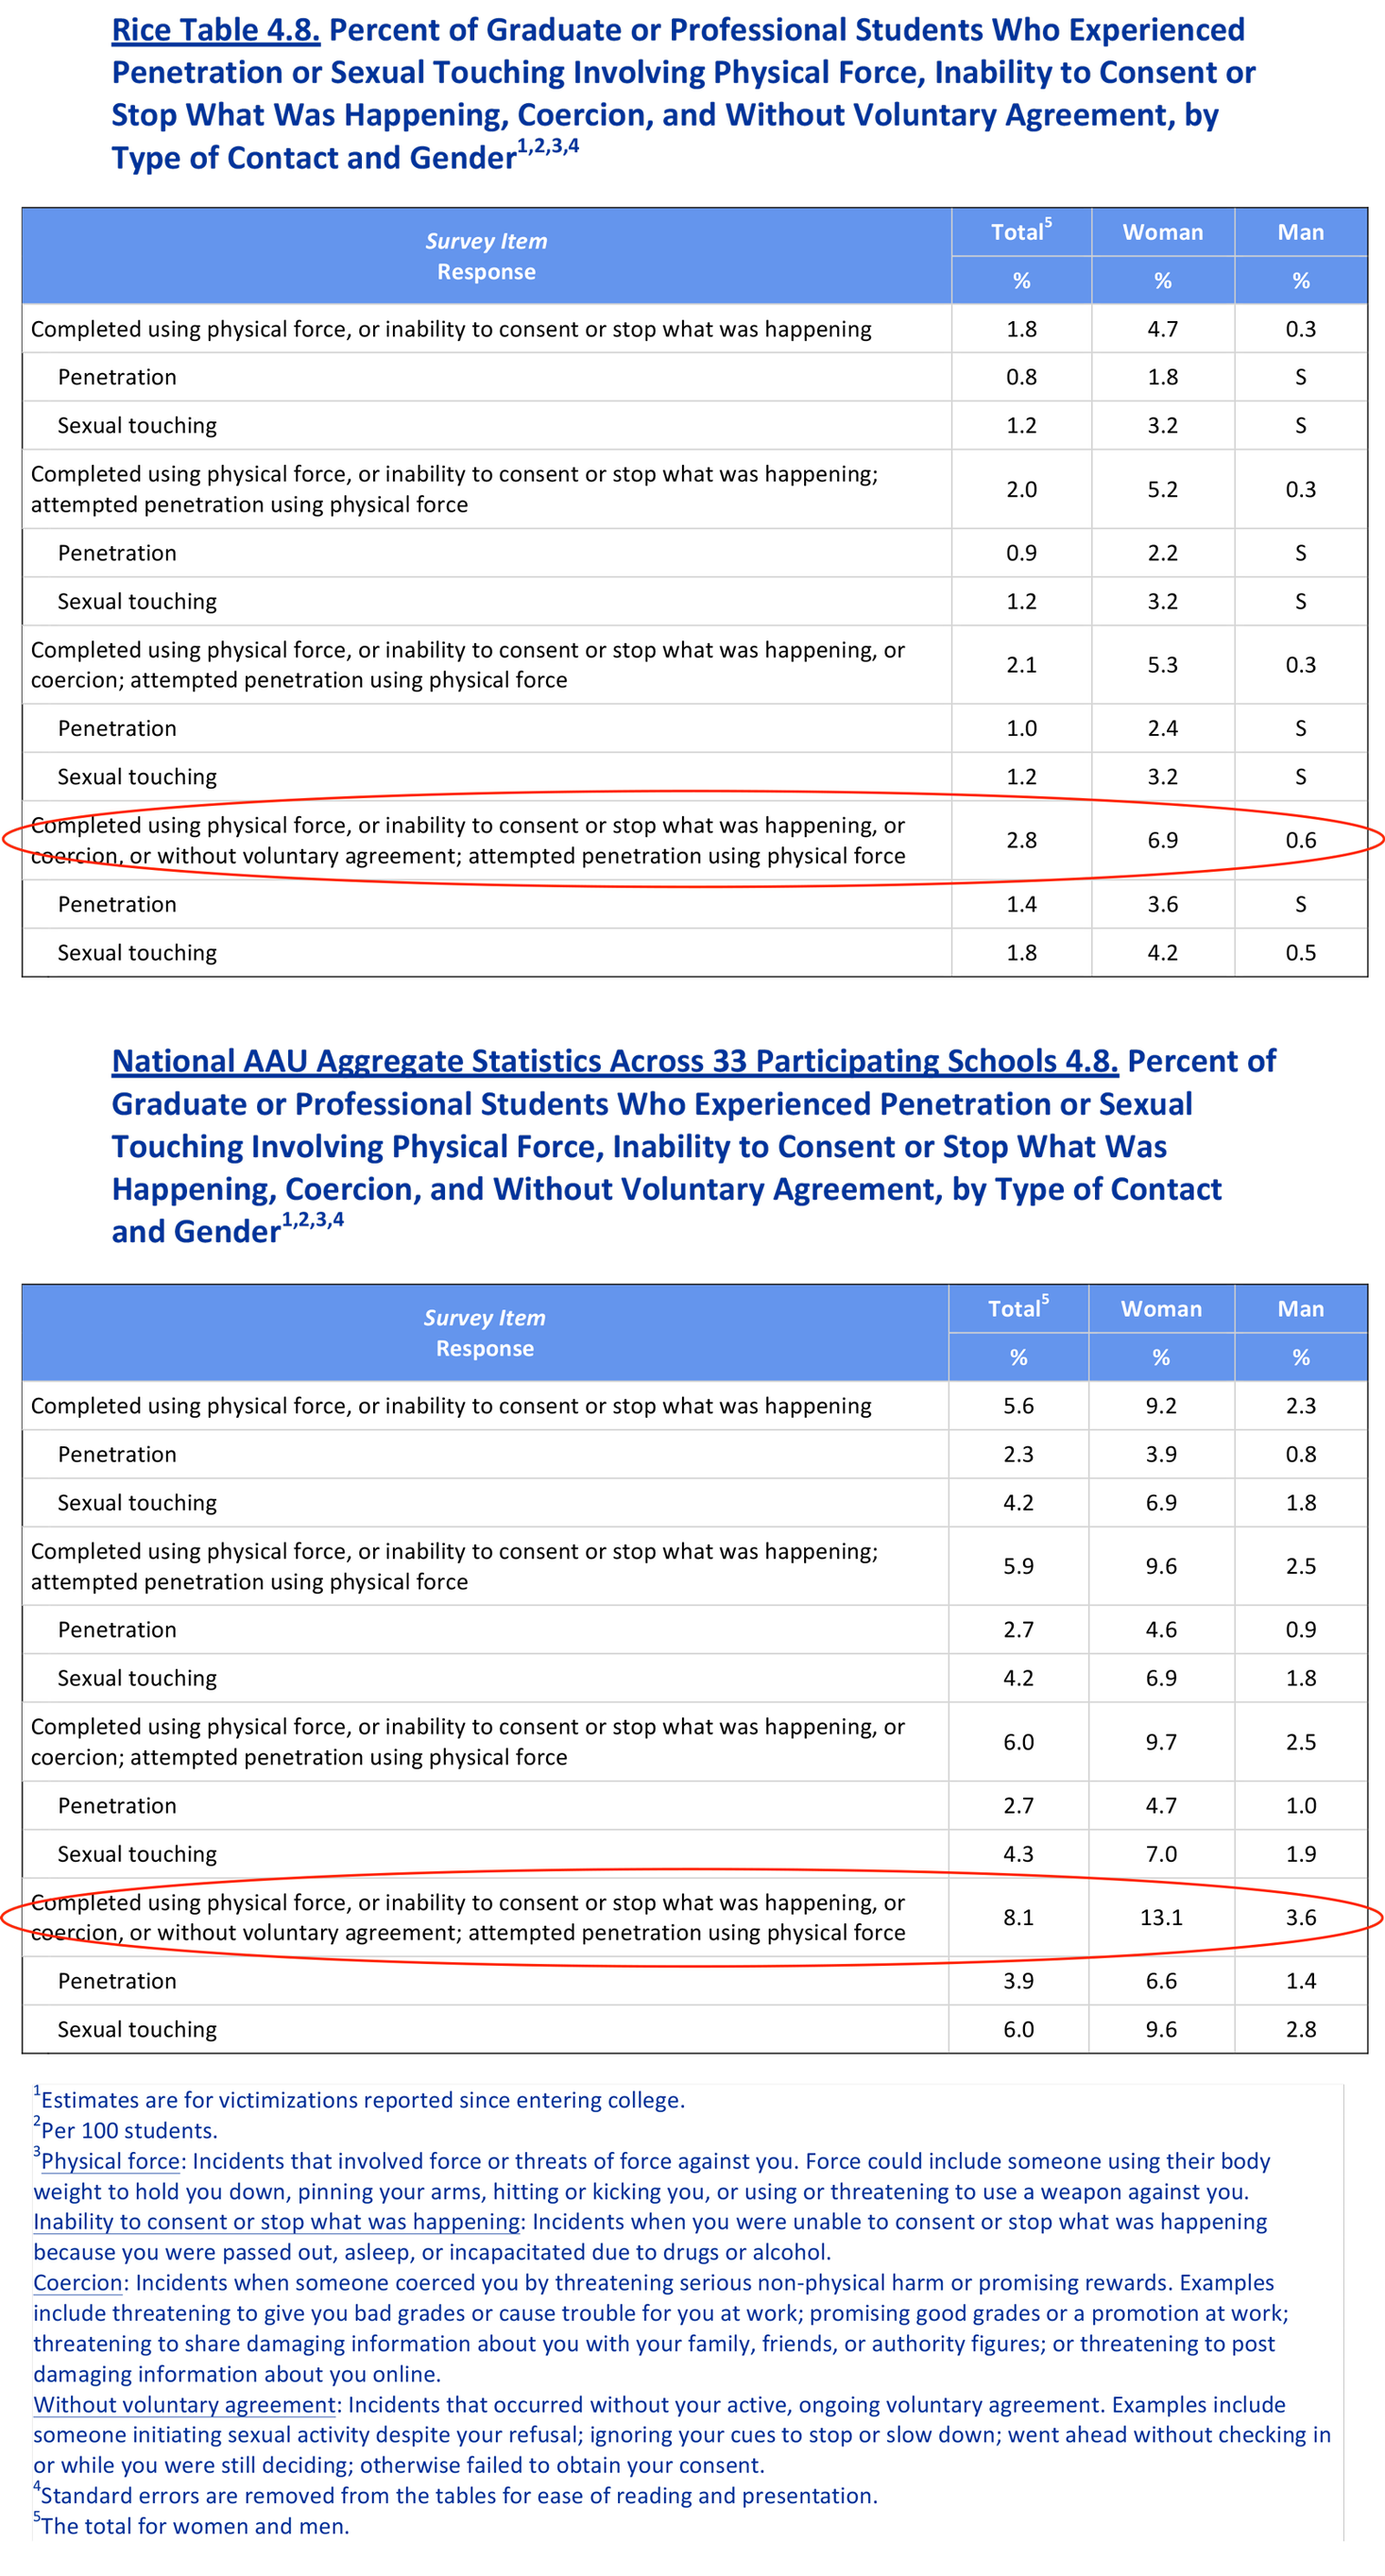
- Table 4.8 (graduate or professional students only): Overall, 6.9% of graduate/professional women and 0.6% of graduate/professional men experienced at least one incident of nonconsensual sexual touching or penetration since enrolling at Rice (comparison with AAU aggregate sample: 13.1% women, 3.6% for men).
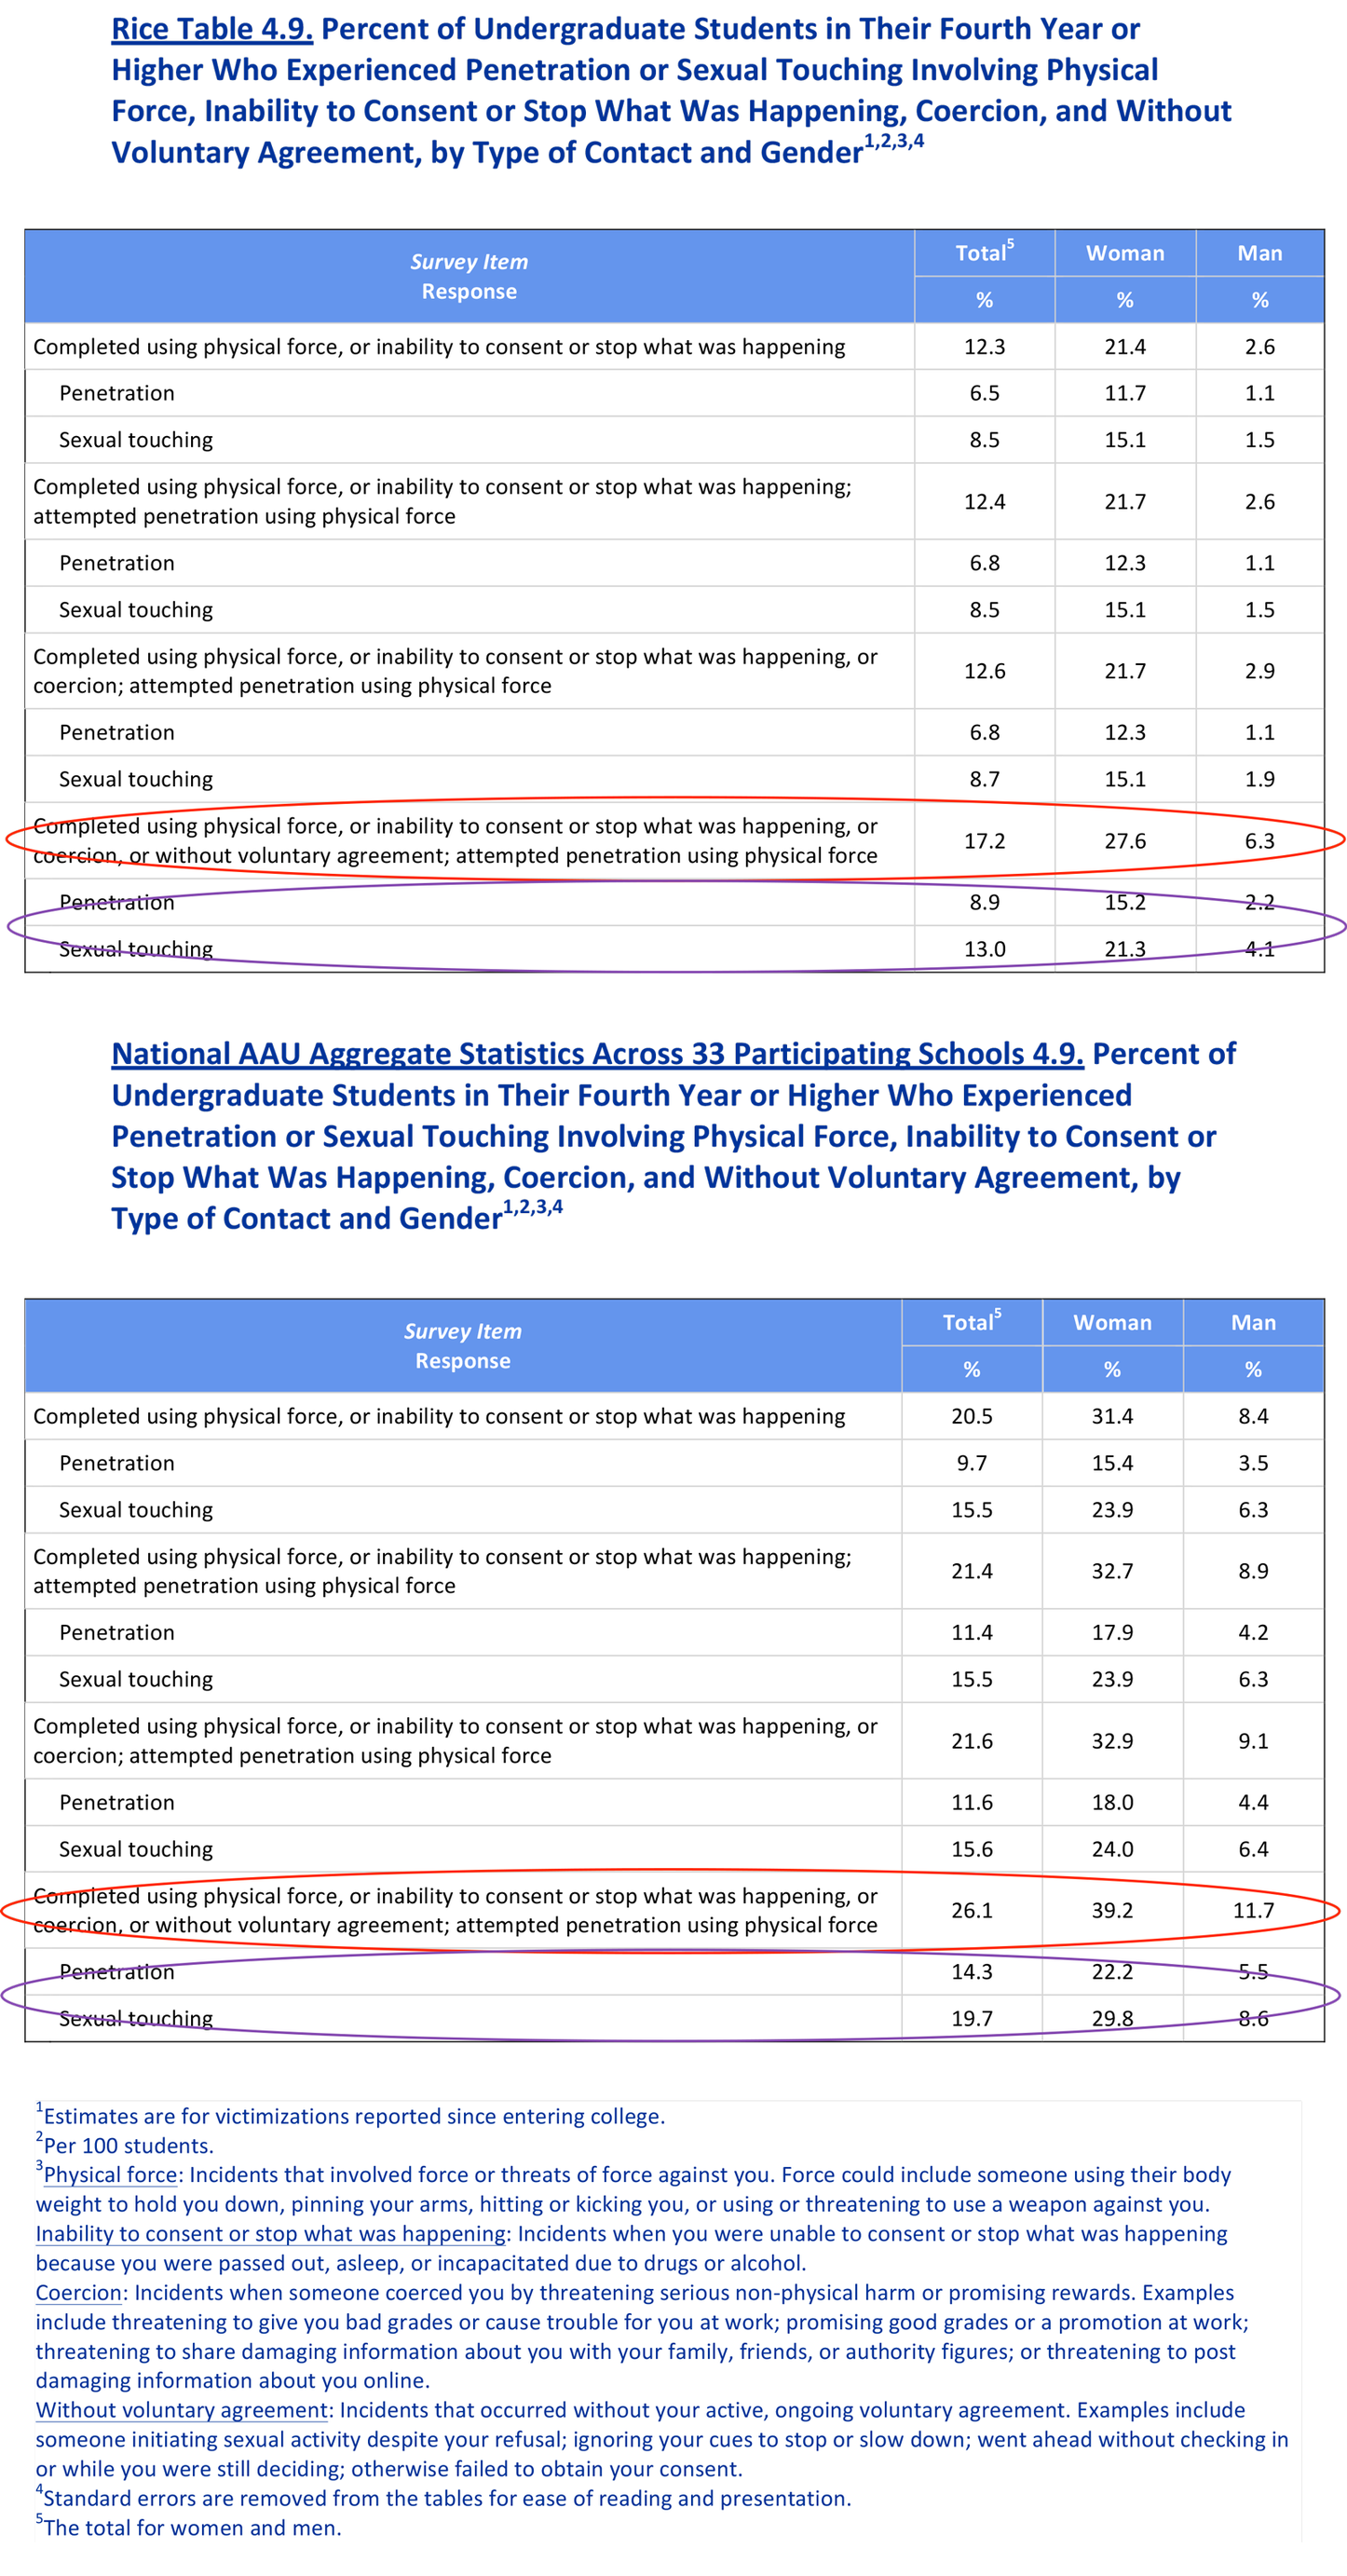
- Table 4.9 (undergraduates in their fourth or higher year of study): Overall, 27.6% of undergraduate women, and 6.3% of undergraduate men, report at least one incident of nonconsensual sexual touching or penetration since enrolling at Rice (comparison with AAU aggregate sample: 39.2% of undergraduate women, 11.7% of undergraduate men).
- For undergraduate women in their fourth or higher year of study: 15.2% report nonconsensual penetration, and 21.3% report nonconsensual sexual touching (comparison with AAU aggregate sample: 22.2% report nonconsensual penetration; 29.8% report nonconsensual sexual touching).
- For undergraduate men in their fourth or higher year of study: 2.2% report nonconsensual penetration, and 4.1% report nonconsensual sexual touching (comparison with AAU aggregate sample: 5.5% penetration, 8.6% sexual touching).
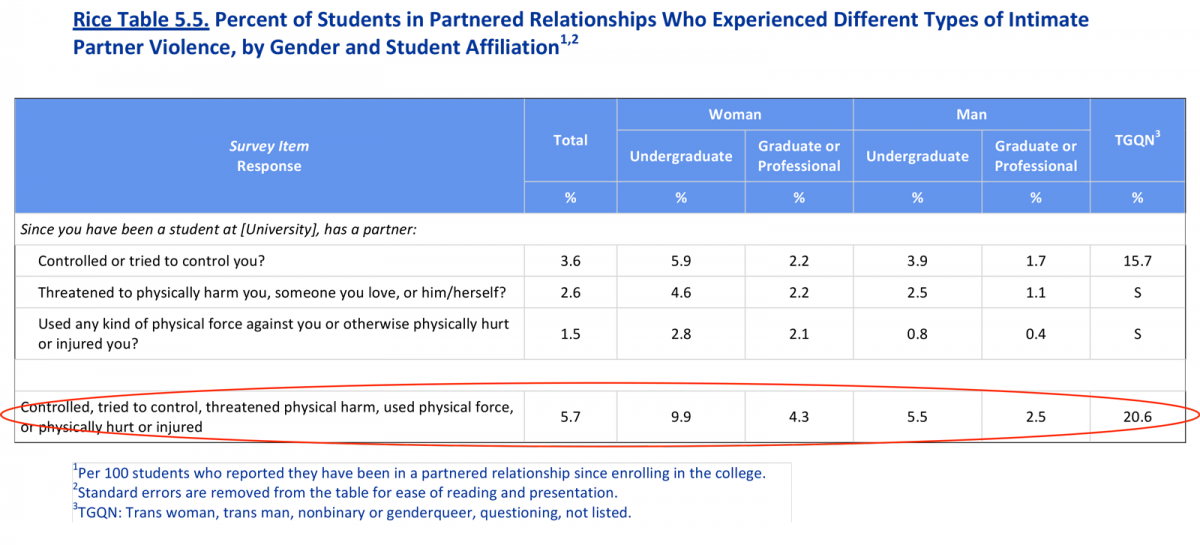
Intimate Partner Violence (Table 5.5)
- Among students who reported having been in a partnered relationship since entering Rice, 5.7% reported they had experienced at least one form of intimate partner violence. This varies across different groups of students, including:
- undergraduate women: 9.9%
- graduate women: 4.3%
- undergraduate men: 5.5%
- graduate men: 2.5%
- TGQN students: 20.6%
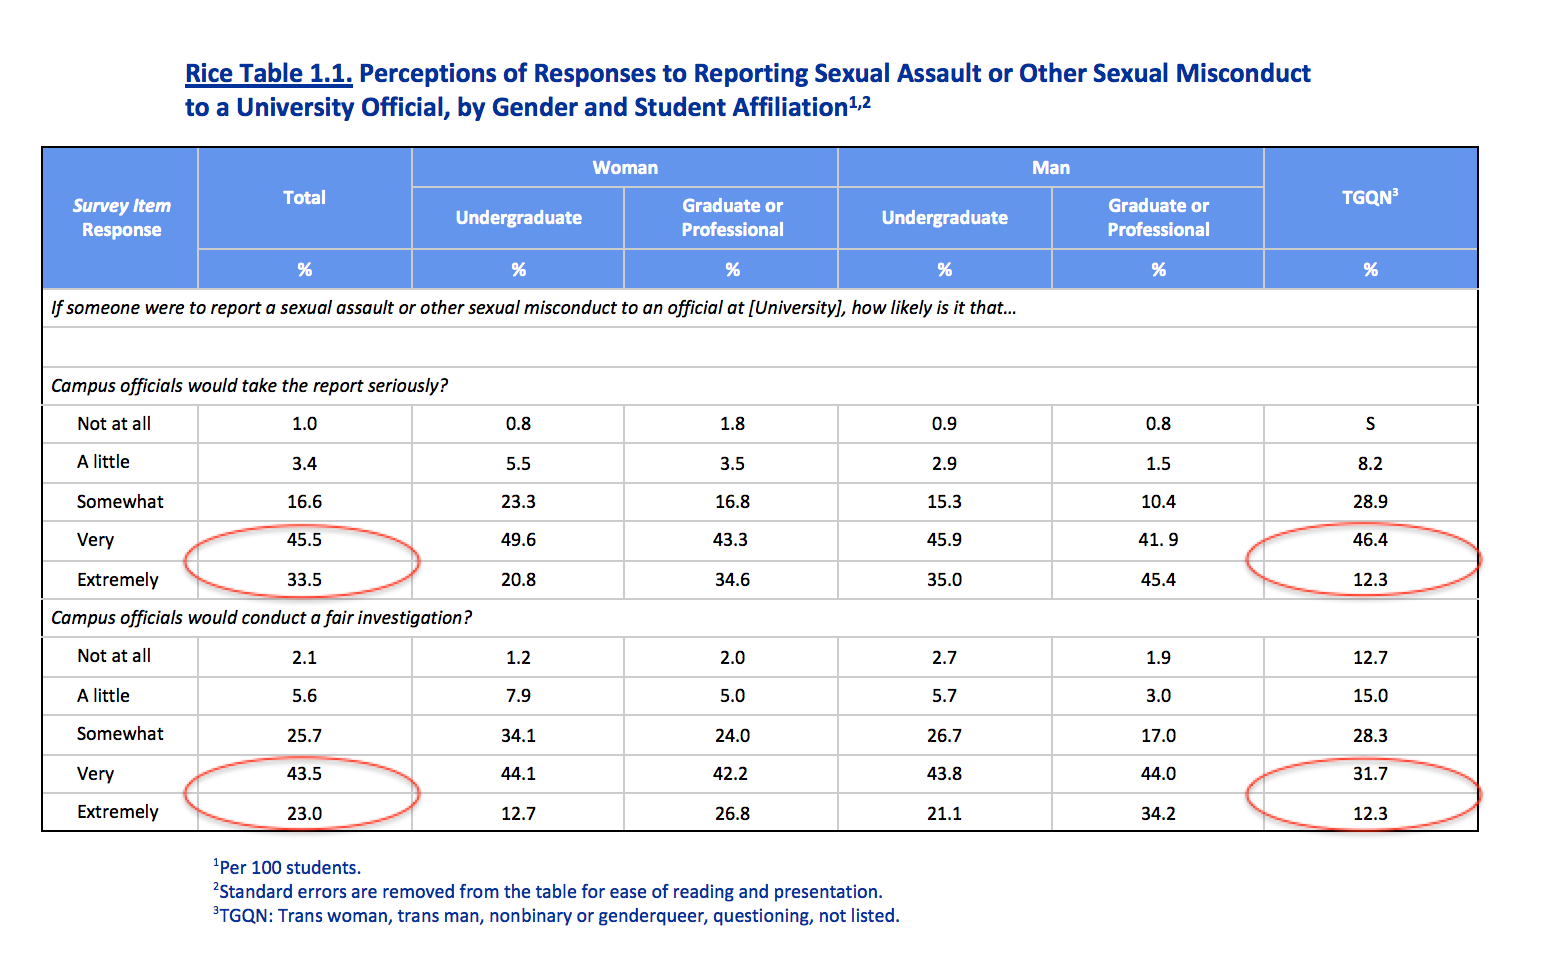
Confidence in the Administration (Table 1.1)
- Overall, 79.0% of Rice respondents thought it was very (45.5%) or extremely likely (33.5%) that university officials would take a report of sexual misconduct or sexual assault seriously.
- Additionally, 66.5% of students indicated that it is very (43.5%) or extremely likely (23.0%) that the university would conduct fair investigations of reports of sexual assault or misconduct.
- Confidence in Rice officials taking sexual misconduct or sexual assault seriously, and in conducting fair investigations, varies by gender and undergraduate/graduate status. Overall, confidence is lowest among TGQN students.
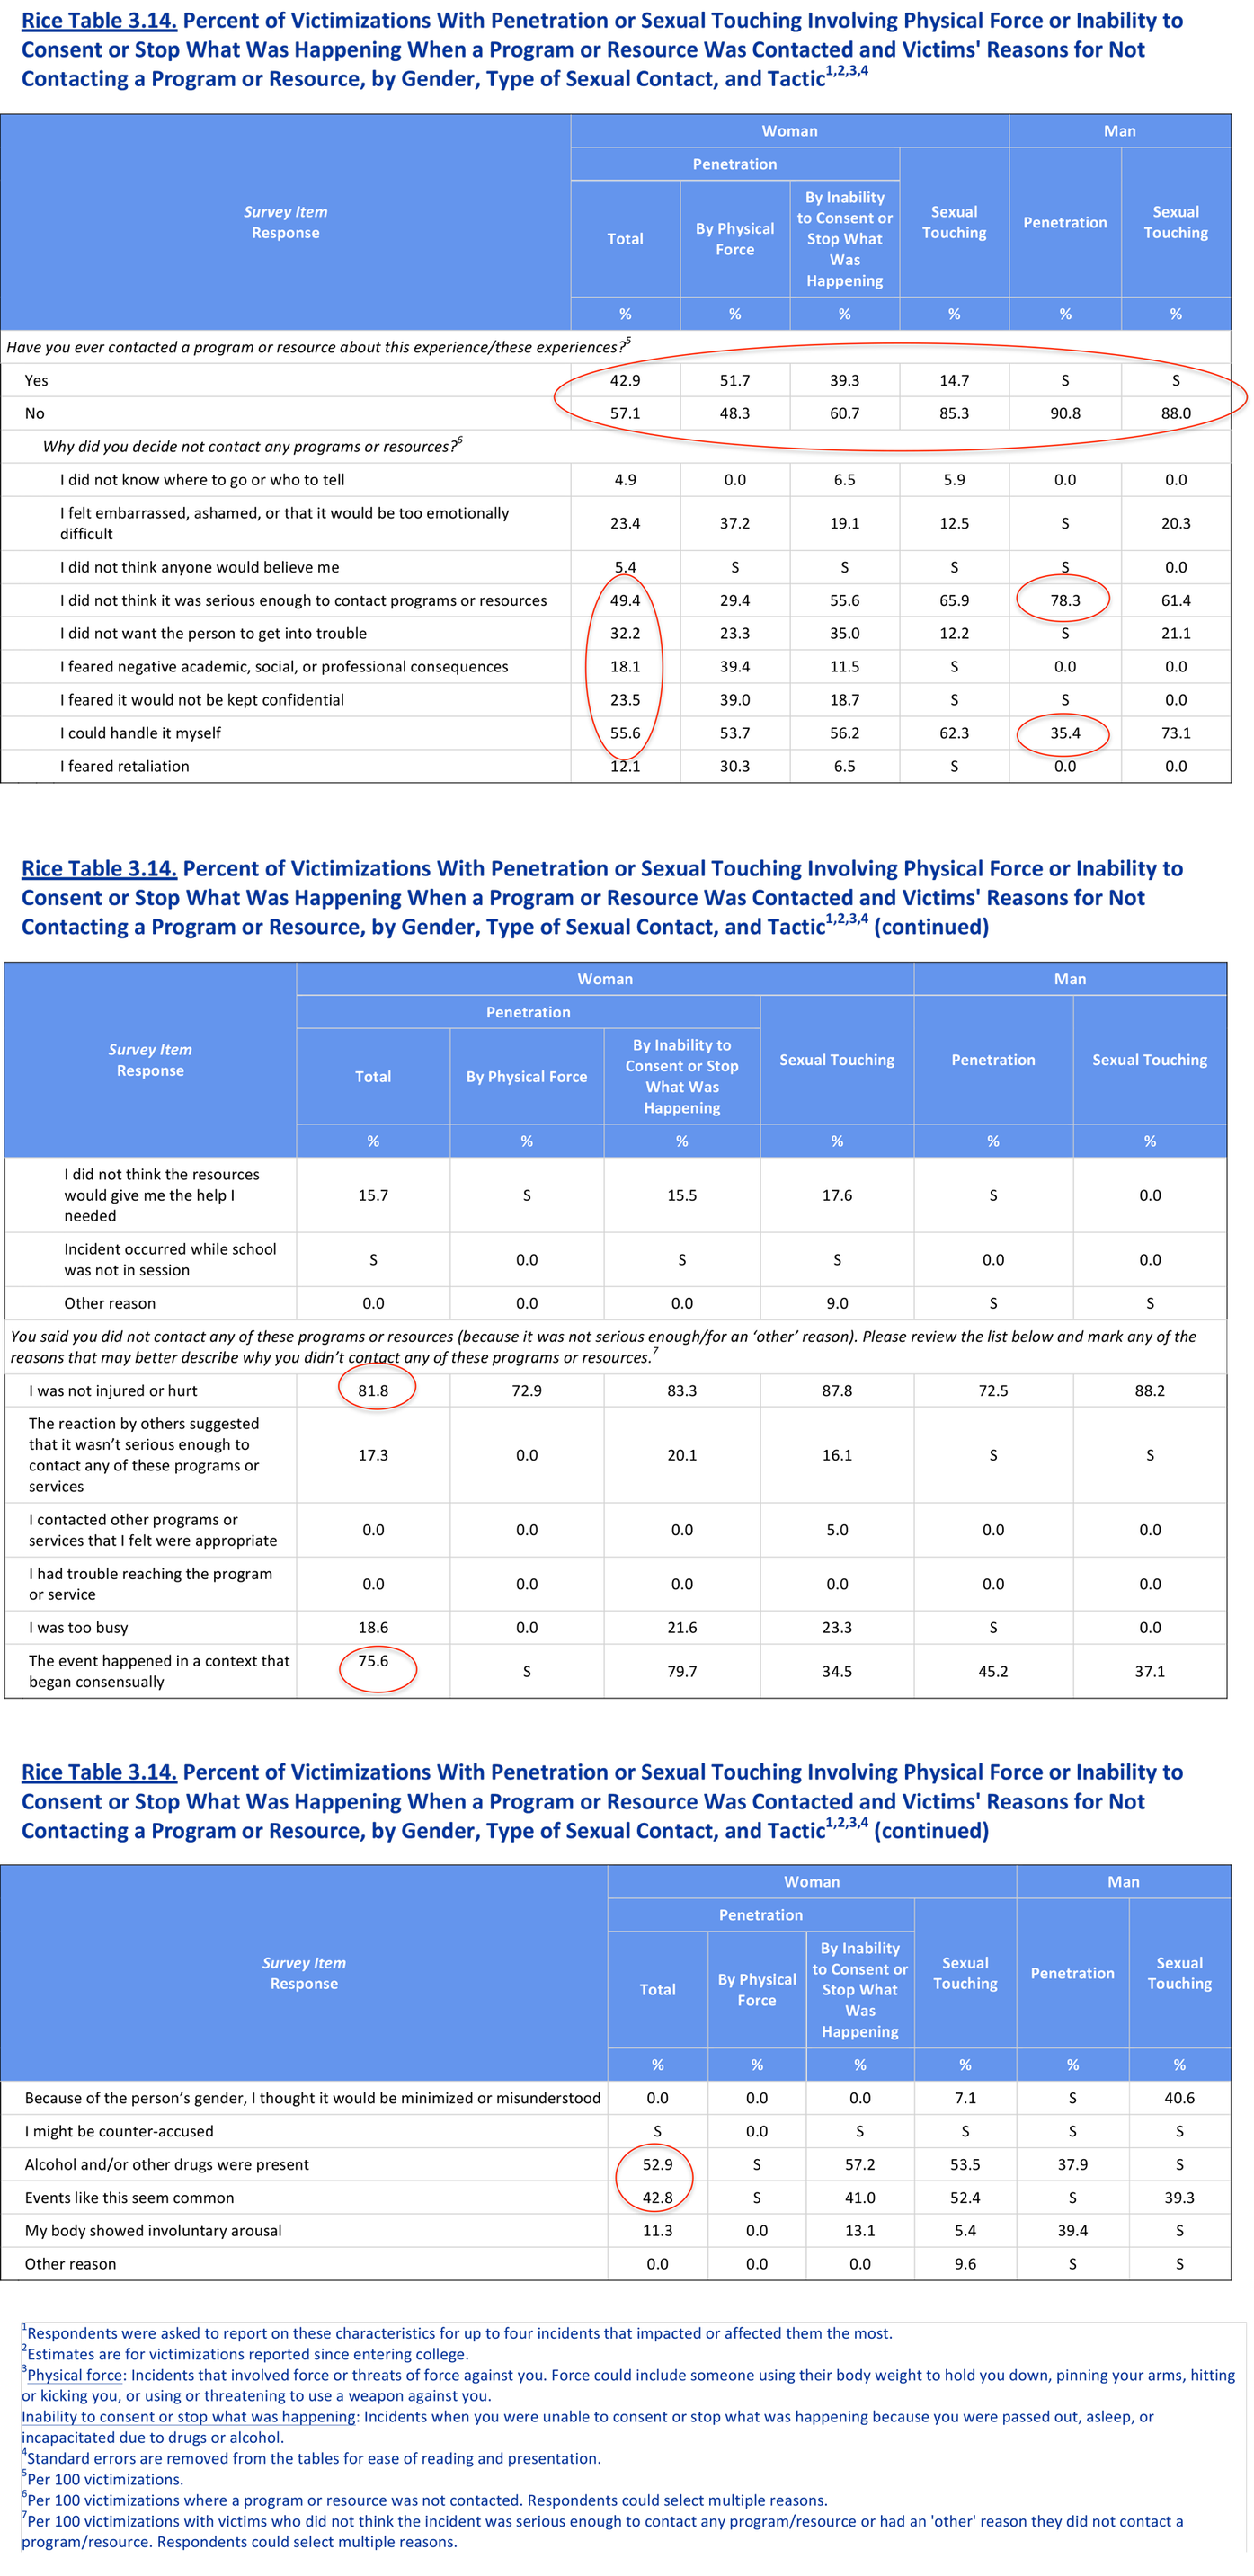
Reporting Behaviors (Table 3.14)
- Overall, 42.9% of women contacted a program or resource about their unwanted sexual experience involving penetration, but 57.1% never contacted a university program or resource following the incident. Nonreporting for women ranged from a low of 48.3% of women who experienced nonconsensual penetration due to physical force, to a high of 85.3% of women who experienced nonconsensual physical touching. For men, rates of nonreporting were very high, from 88.0% for sexual touching and 90.8% for penetration.
- When asked about reasons for not reporting:
- Almost half (49.4%) of women victims of penetration did not contact a program or resource about the incident because they did not think it was serious enough to warrant contact. Just over half (55.6%) also said that they could handle it themselves, while almost a third (32.2%) did not make any contact because they did not want to get the perpetrator in trouble. Another 23.5% of women feared the incident would not be kept confidential, and 18.1% feared negative academic, social or professional consequences.
- For men, by far the most common reasons for not reporting was that they did not think the incident was serious enough to contact programs or resources (78.3%), and that they could handle it themselves (35.4%).
- Among women who did not report and who said it was because the incident was not serious enough to contact university programs or resources, over four out of five women (81.8%) reported that they were not injured or hurt; three-quarters (75.6%) said that it was because the event happened in a context that began consensually; 52.9% said it was because alcohol and/or other drugs were present; and 42.8% said it was because events like this seem common.
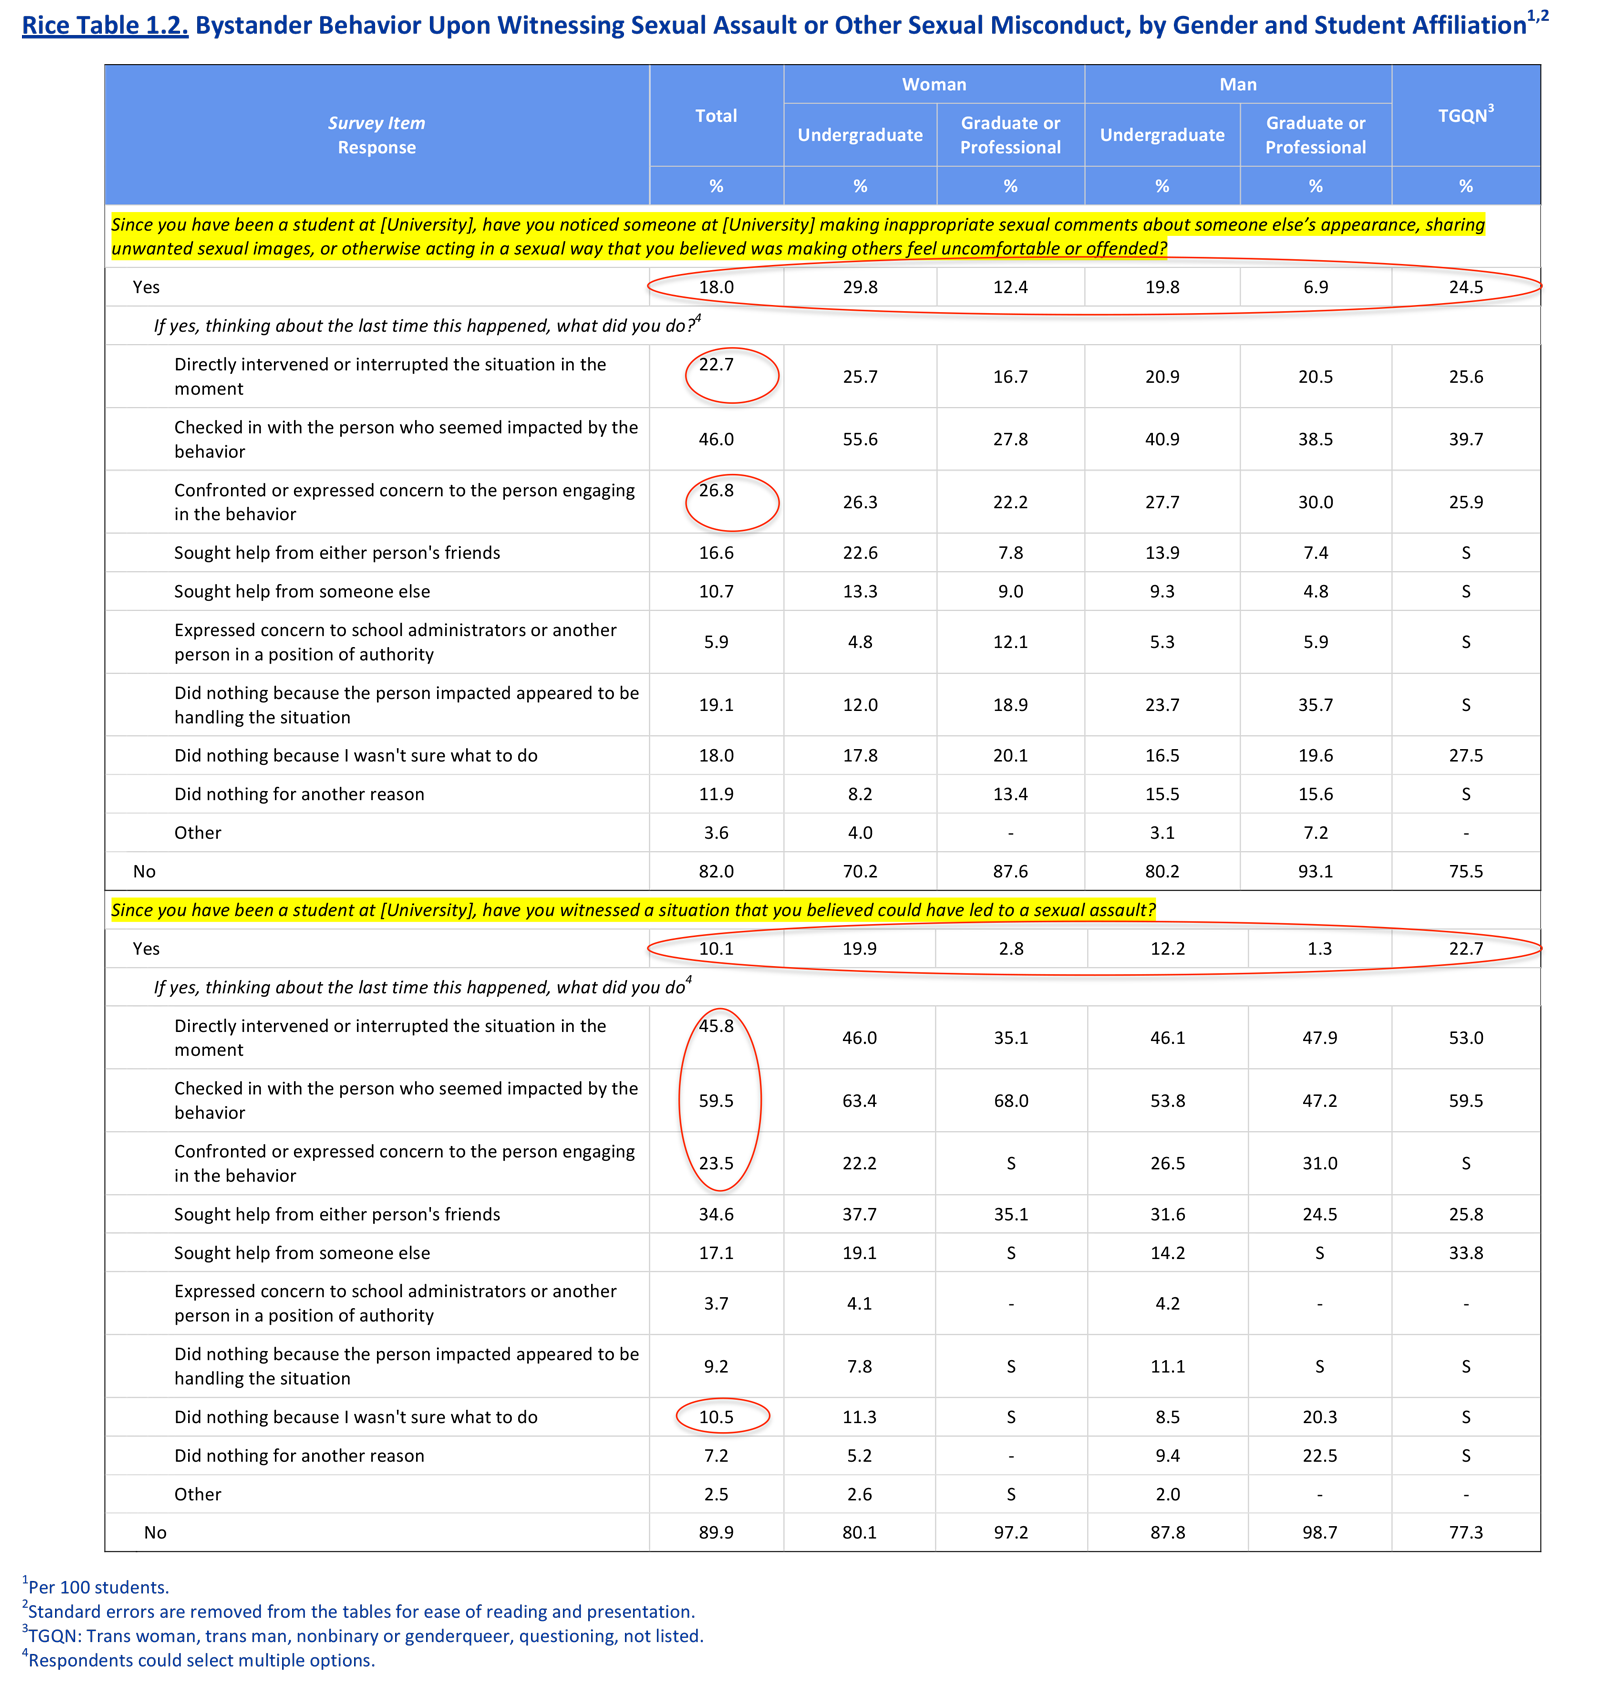
Bystander Intervention (Table 1.2)
- Overall, 18.0% of students reported that, during their time at Rice, they had noticed someone at Rice making inappropriate comments about another person’s appearance, sharing unwanted sexual images, or otherwise acting in a sexual way they believed was making others feel uncomfortable or offended. 29.8% of undergraduate women, 19.8% of undergraduate men, and 24.5% of TGQN students reported these experiences.
Among students who witnessed this type of behavior, about one-quarter either directly intervened or interrupted the situation (22.7%), or confronted or expressed concern to the person engaging in the behavior (26.8%).
- Overall, 10.1% of students indicated that, during their time at Rice, they had witnessed a situation at Rice they believed could have led to a sexual assault. This is more common among undergraduates and TGQN students, with 19.9% of women, 12.2% of men and 22.7% of TGQN reporting.
- Among those who witnessed this type of incident, many students reported that they took some type of action - including 45.8% who directly intervened or interrupted the situation, 59.5% who checked in with the student who seemed impacted by the behavior, and 23.5% who confronted or expressed concern to the person engaging in the behavior. However, 10.5% reported that they did nothing because they were unsure of what to do.
Campus Climate and the Culture of Care (Table 1.4)
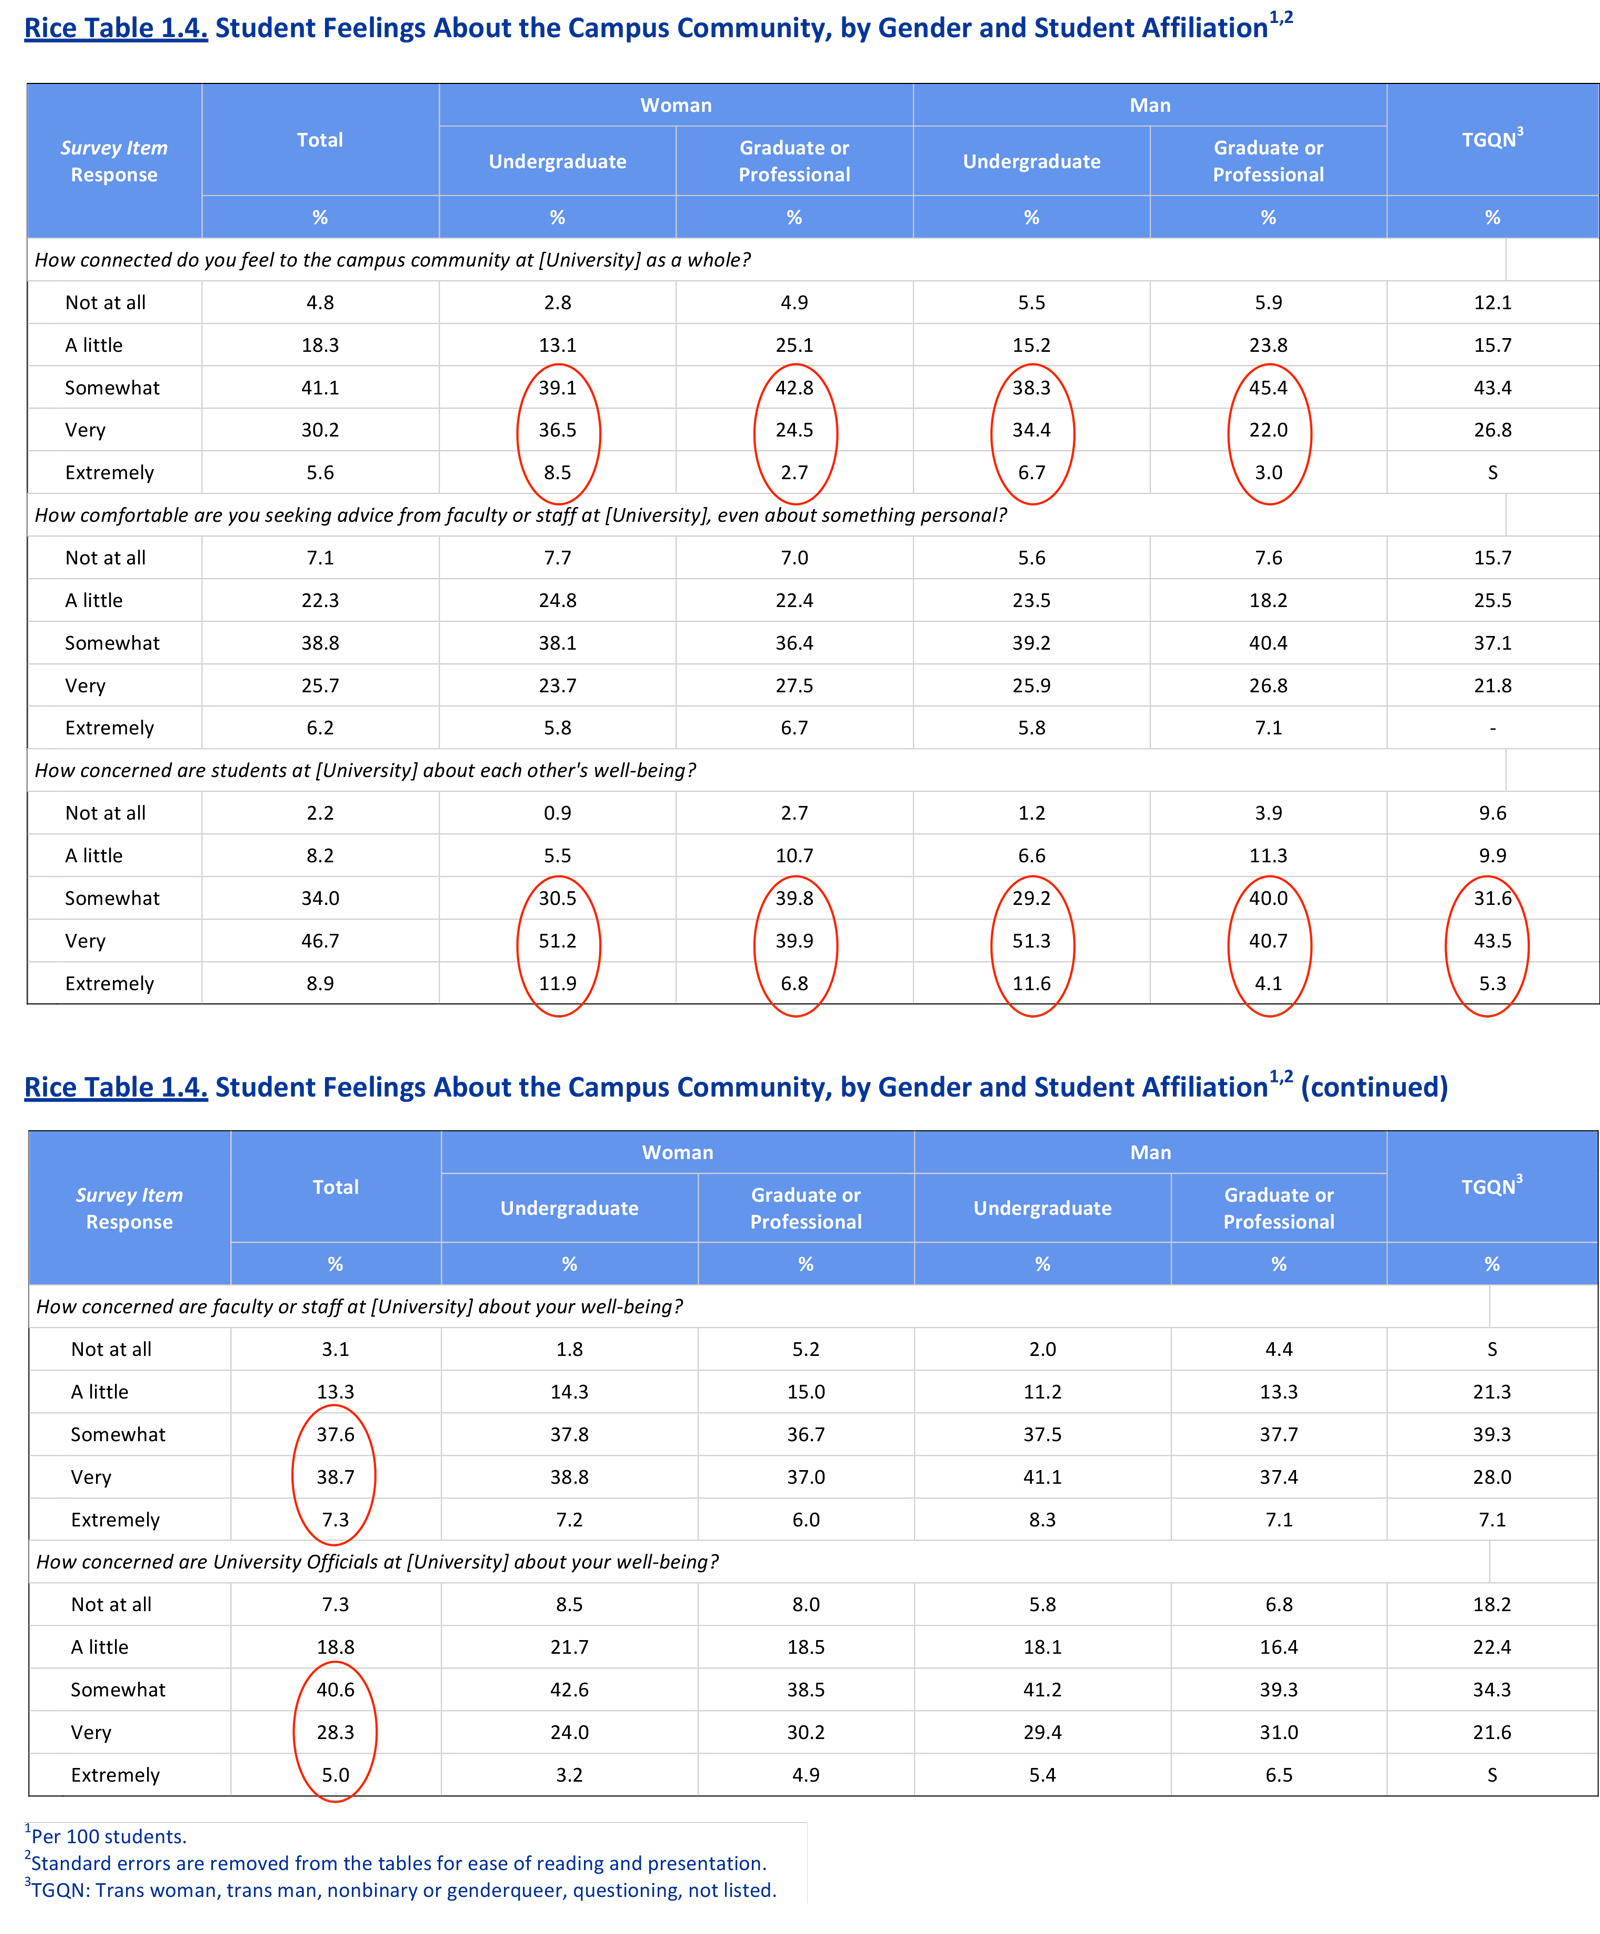
- A majority of undergraduate women (84.1%) and men (79.4%), as well as graduate women (70.0%) and men (70.4%) report feeling somewhat, very or extremely connected to the Rice community.
- Overall, 93.6% of undergraduate women and 92.1% of undergraduate men, and 86.5% of graduate women and 84.8% of graduate men, believe that their peers are concerned about their well-being. For TGQN students, 80.4% feel that their peers are concerned about their well-being.
- Overall, 83.6% of students report that Rice faculty or staff, and 73.9% of university officials, are somewhat, very or extremely concerned about their well-being.
Awareness of Services (Table 2.1)
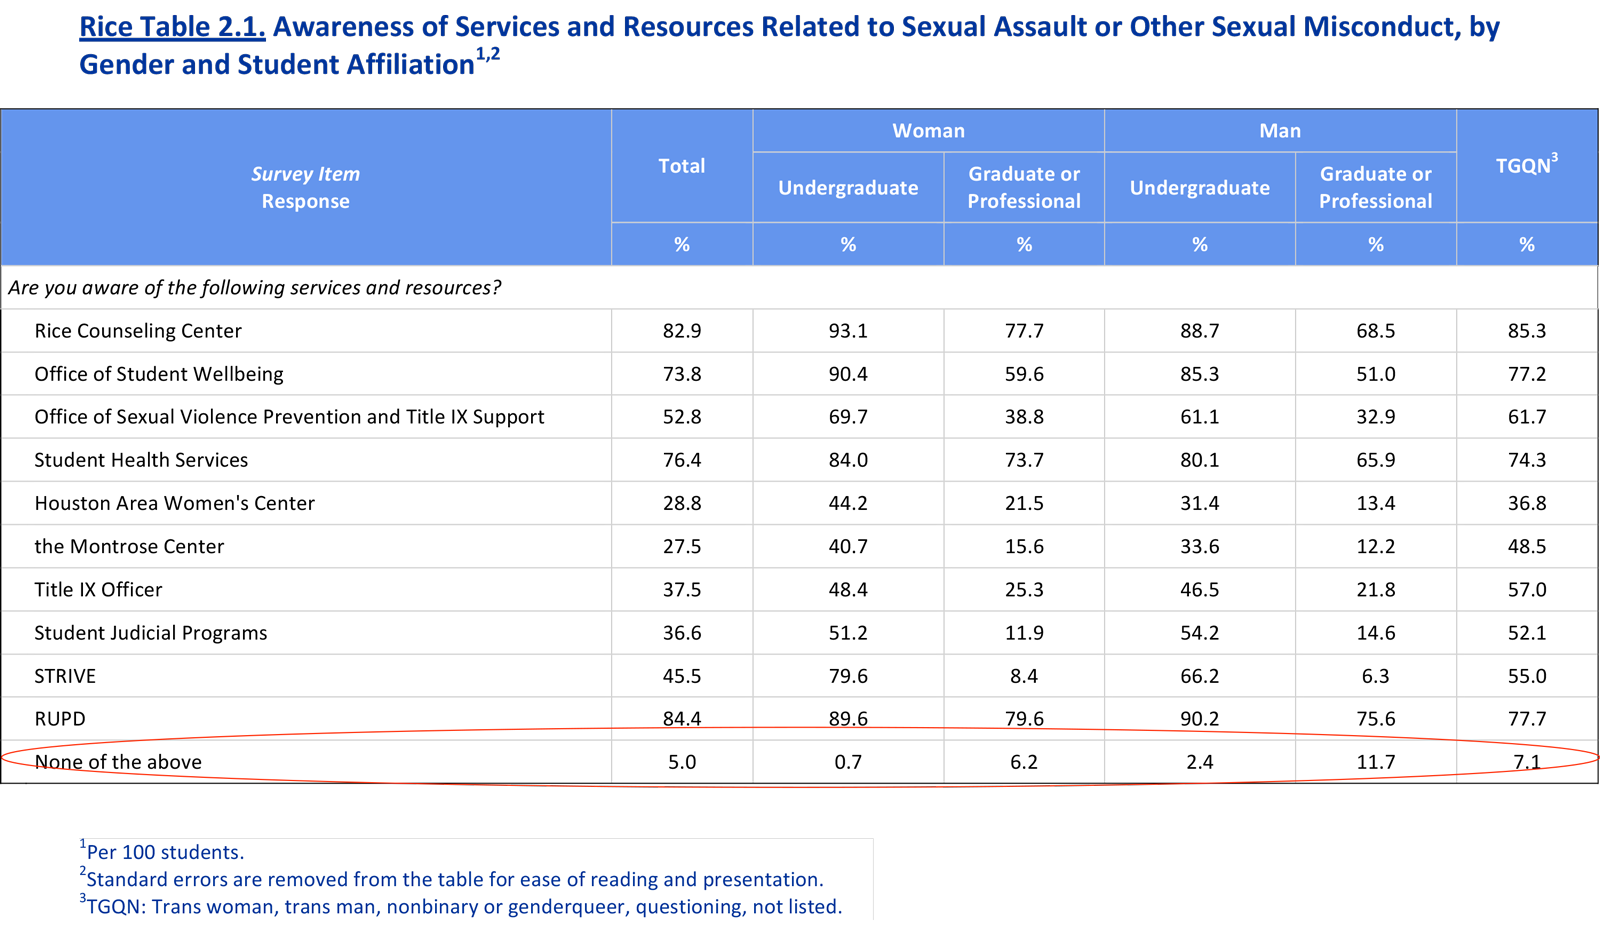
- Overall, 95% of students reported awareness of one or more campus offices devoted to sexual health, wellbeing, and/or safety with only 5.0% stating they were not aware of any of the ten services or resources available through Rice.[1] Table 2.1 shows that graduate students are less knowledgeable about university resources than undergraduates.
Knowledge of Policies and Resources (Table 2.2)
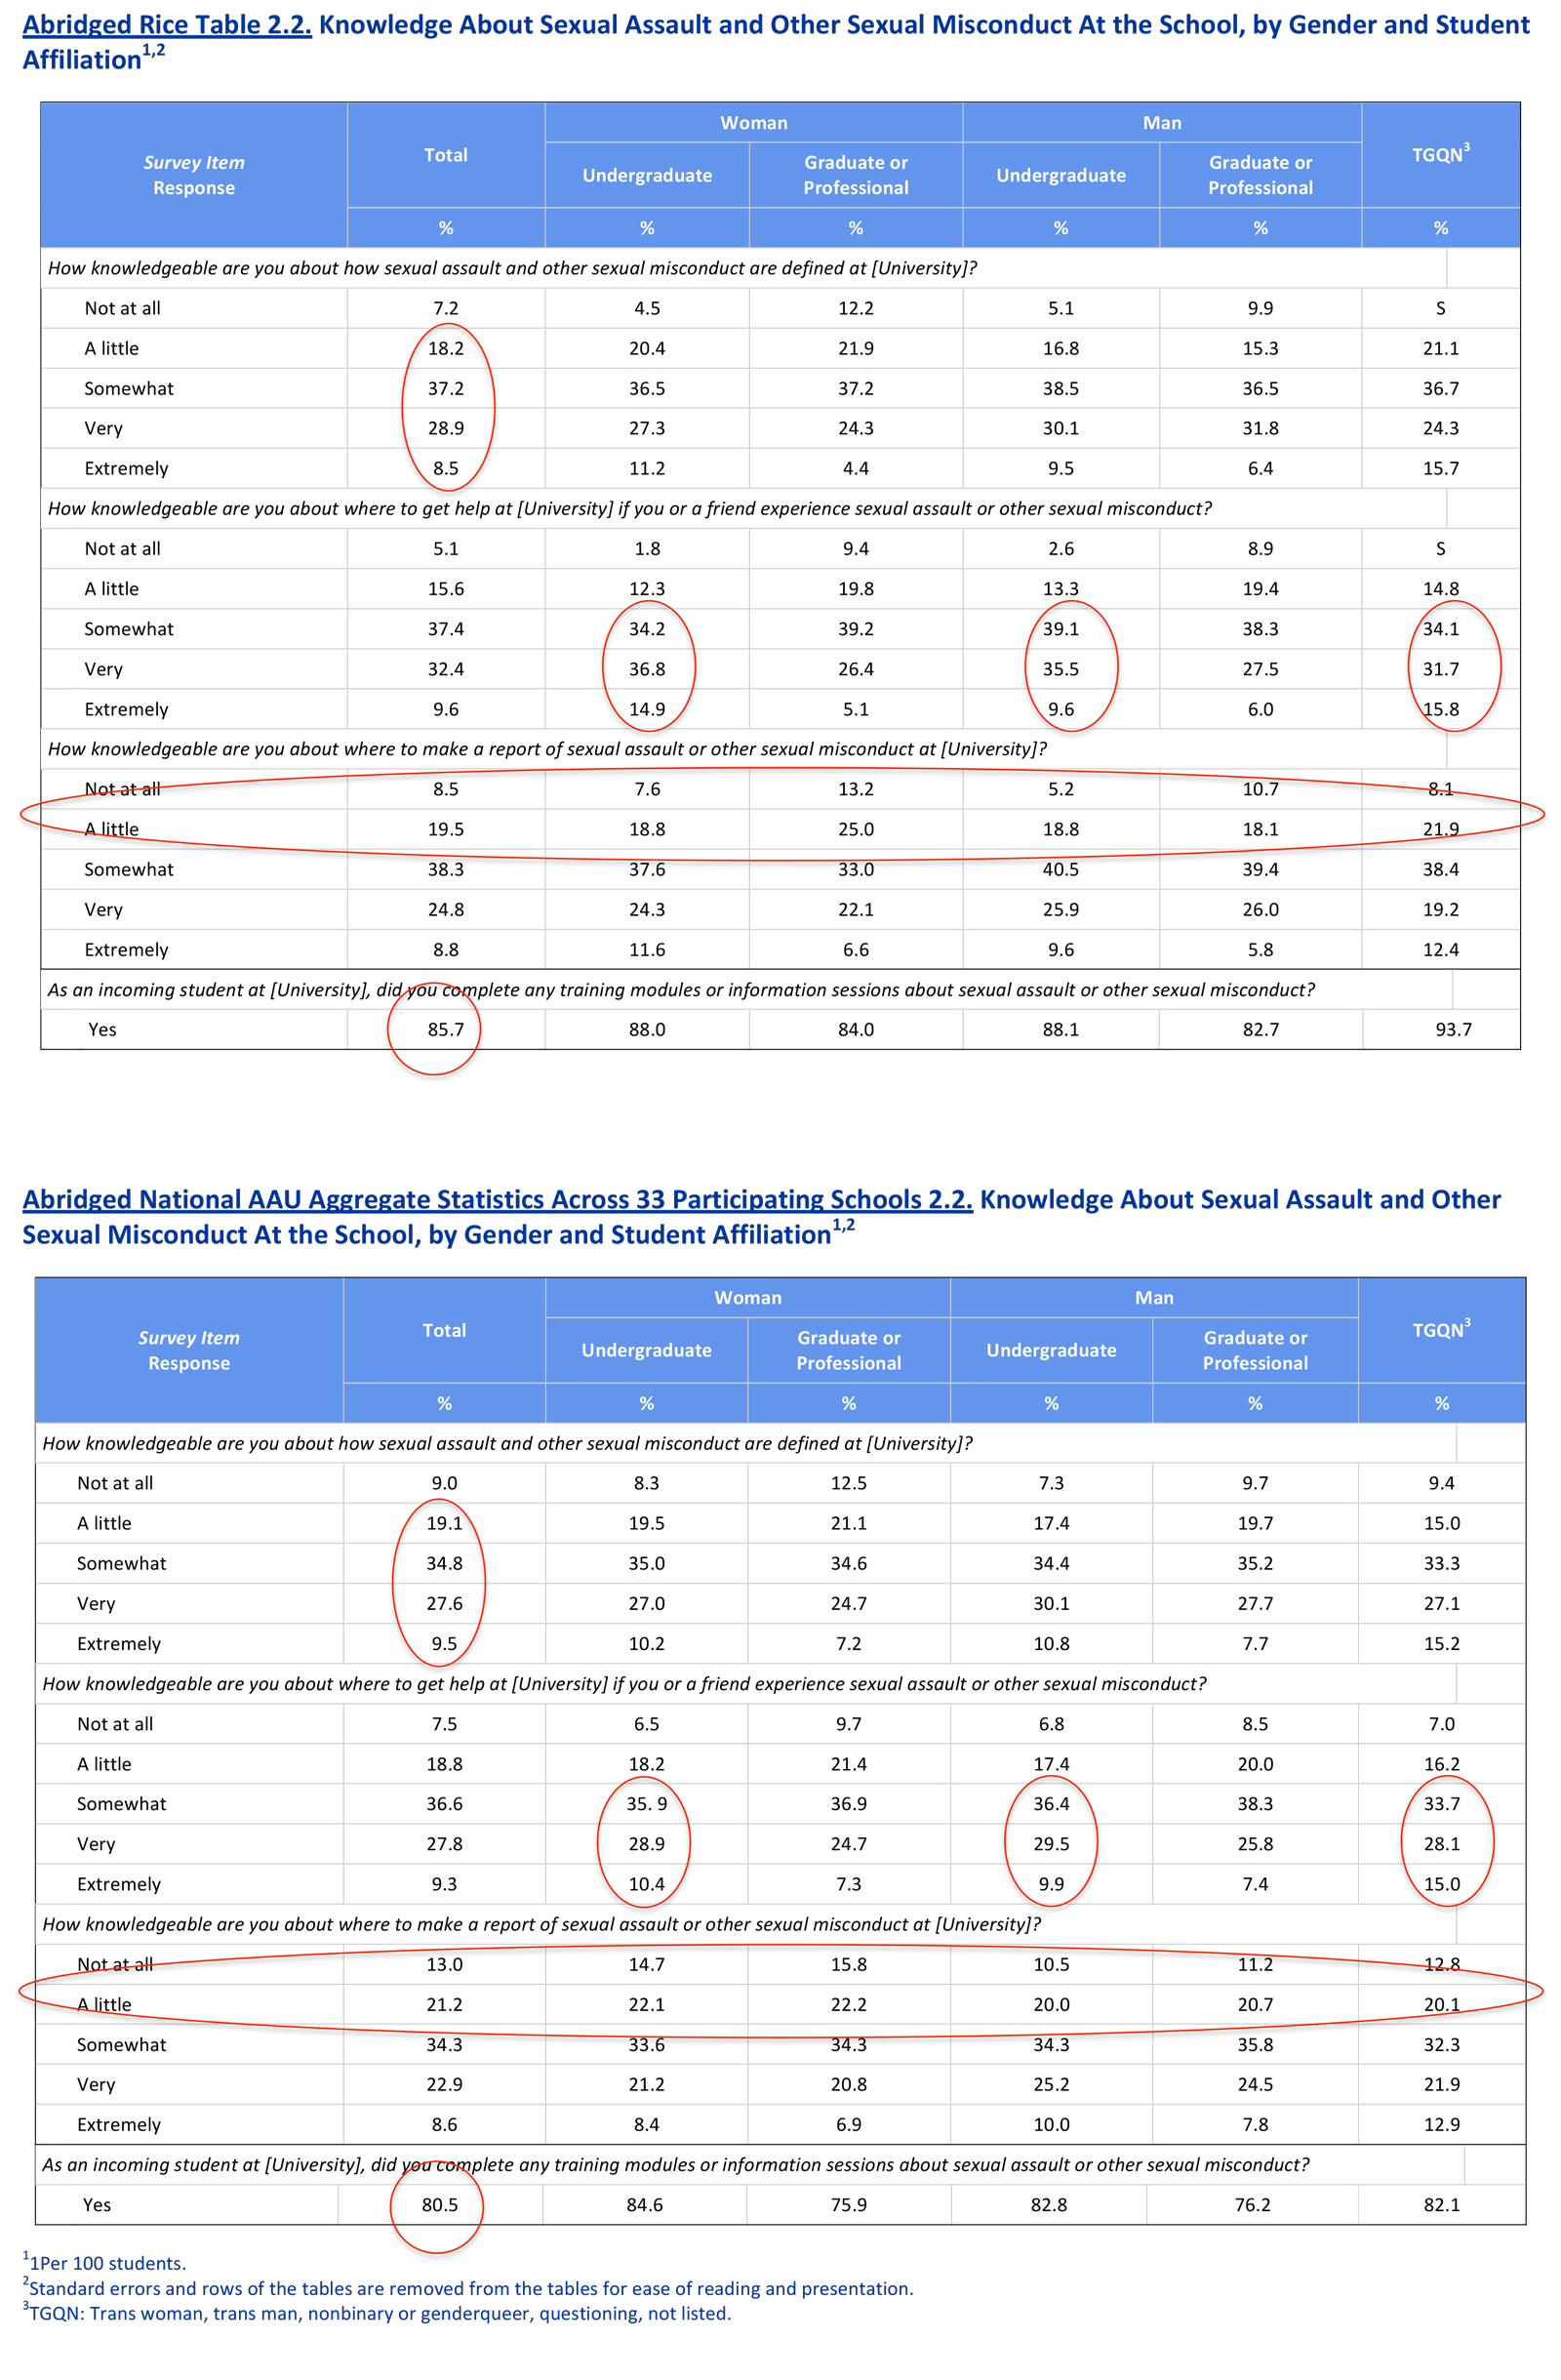
- Overall, 92.8% of students reported having at least “a little” knowledge about how sexual misconduct is defined at Rice (comparison with AAU aggregate sample = 91.0%). 74.6% of Rice students reported being “somewhat” to “extremely” knowledgeable (comparison with AAU aggregate sample of 71.9%)
- Undergraduate women and men (85.9% and 84.2%, respectively) appear to be equally knowledgeable about where to go for help for themselves or a friend in the event of a sexual assault, with a somewhat lower rate (81.6%) among TGQN students (comparison with AAU aggregate sample: 75.2% women, 75.8% men, 76.8% TGQN students).
- 85.7% of students report having had training on sexual misconduct policies, consent and resources as an incoming student (comparison with AAU aggregate sample = 80.5%). However, as shown in Table 2.2, about one-quarter of undergraduates and one-third of graduate and professional students at Rice report having little or no knowledge on where to report (comparison with AAU aggregate sample of about one-third of all students, undergraduates and graduates).
Consequences of Victimization (Tables 3.12 and 3.13)
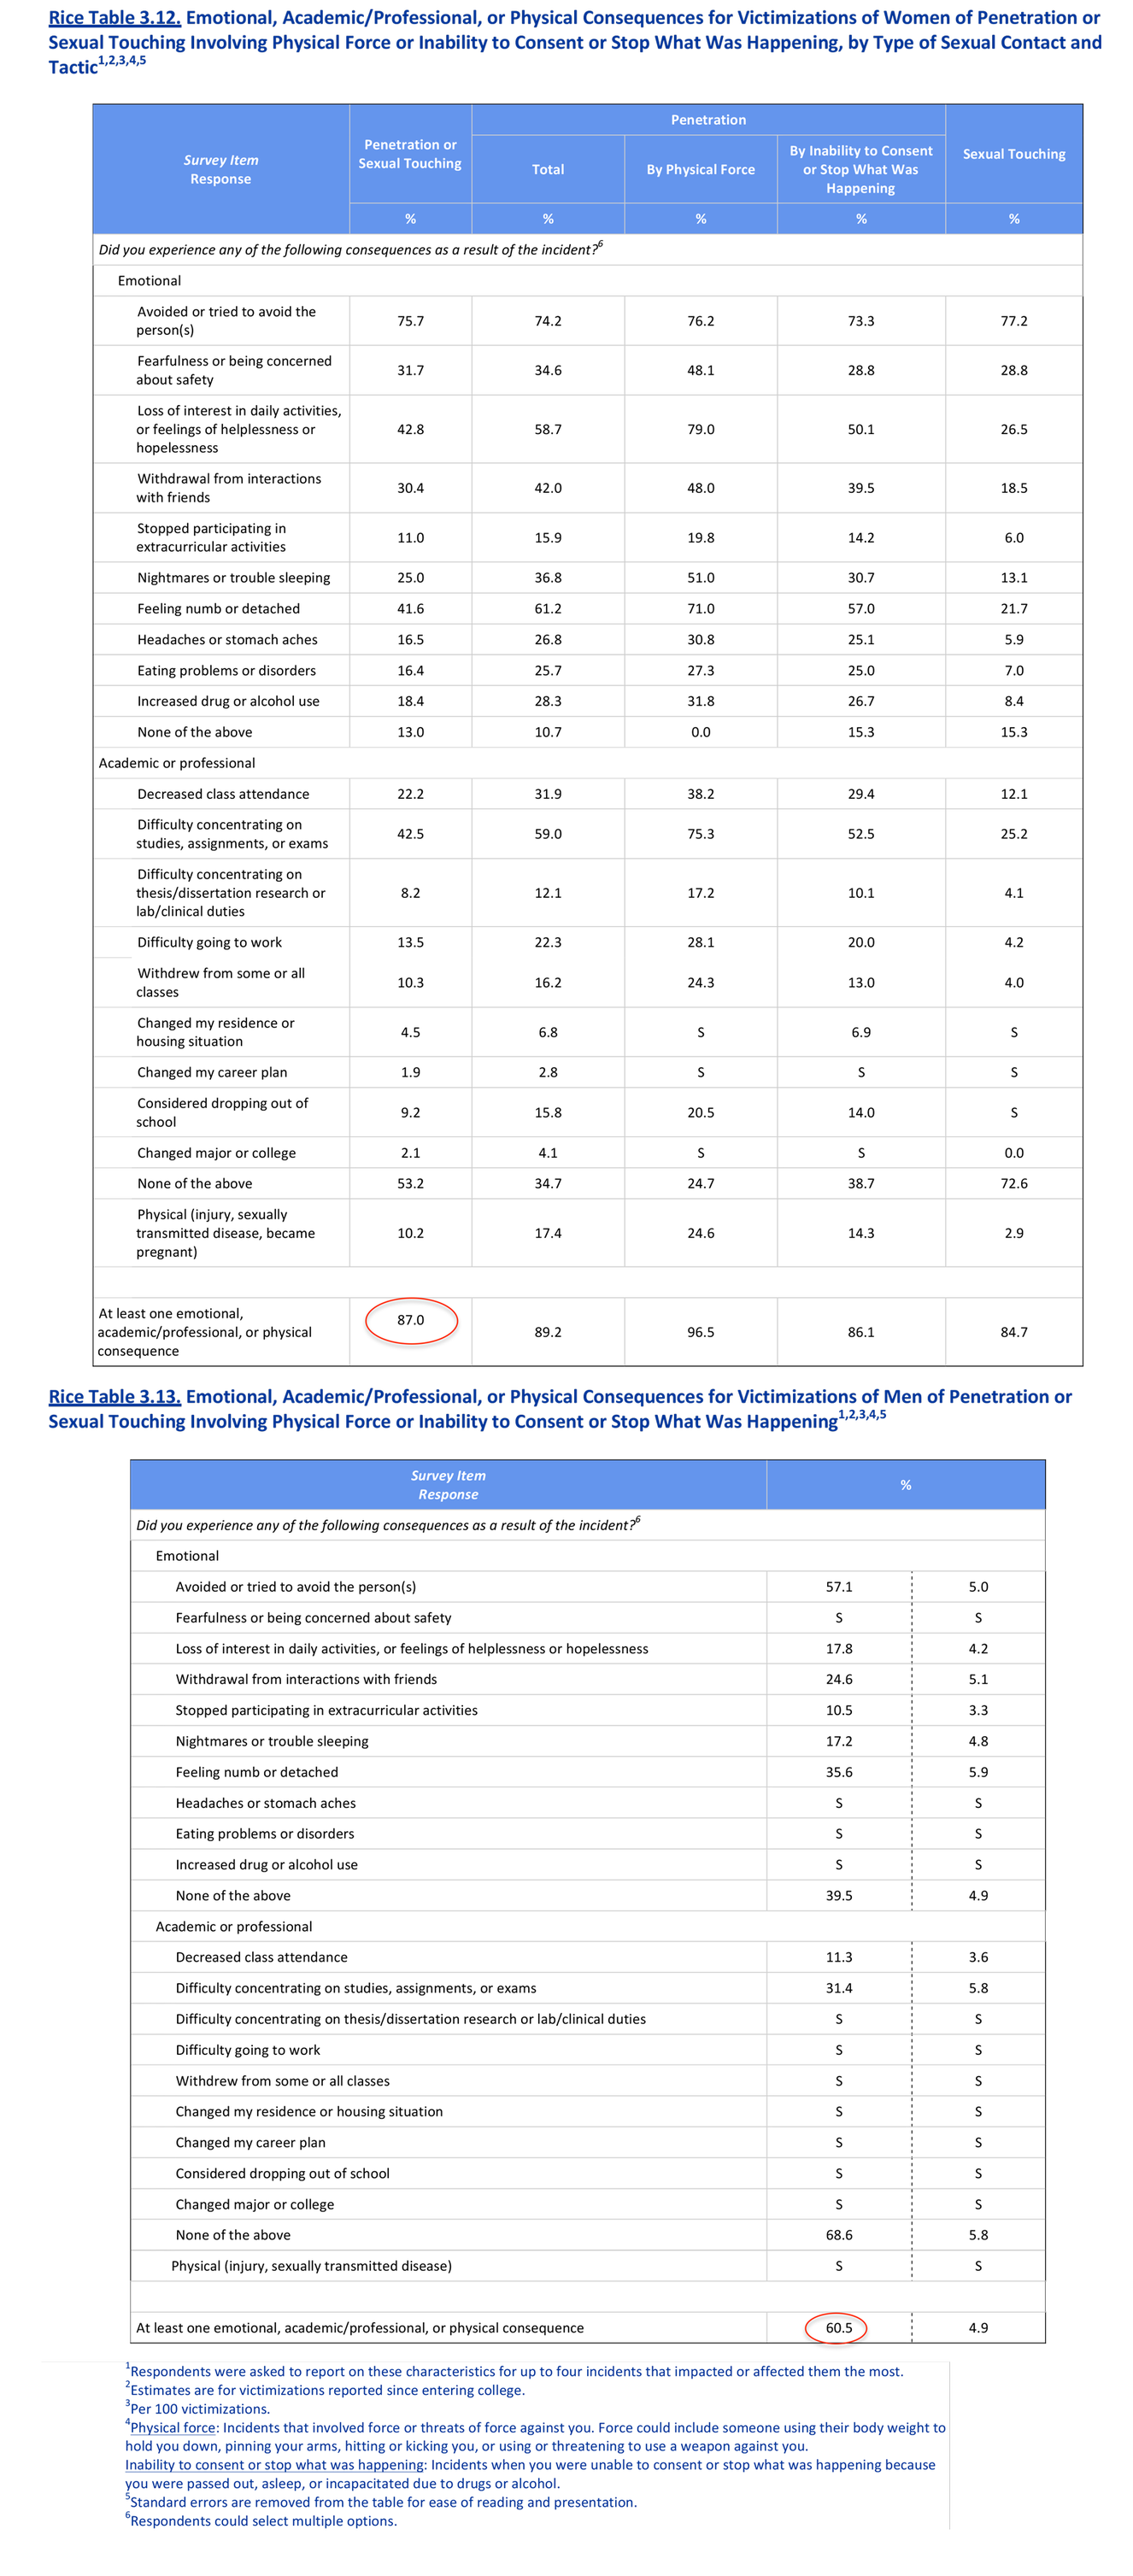
- Tables 3.12 and 3.13 describe the substantial consequences of victimization for women and men. Overall, 87.0% of women and 60.5% of men report at least one emotional, academic/professional or physical consequence from nonconsensual penetration or sexual touching involving physical force or inability to consent or stop what was happening.
Comparison of 2019 AAU Data with 2015 SUSE Data:
Rice did not participate in the AAU survey in 2015 but, instead, administered its own Survey on Unwanted Sexual Experiences (SUSE). Unlike the current AAU survey, the SUSE asked only about incidents of unwanted sexual experiences and did not ask a broader set of questions about campus climate, student perceptions or knowledge of policies and resources. In addition, the methodology for how the surveys collected information on unwanted sexual experiences differed in selected ways. Because of this, our ability to compare across the 2019 AAU and the 2015 SUSE is limited.
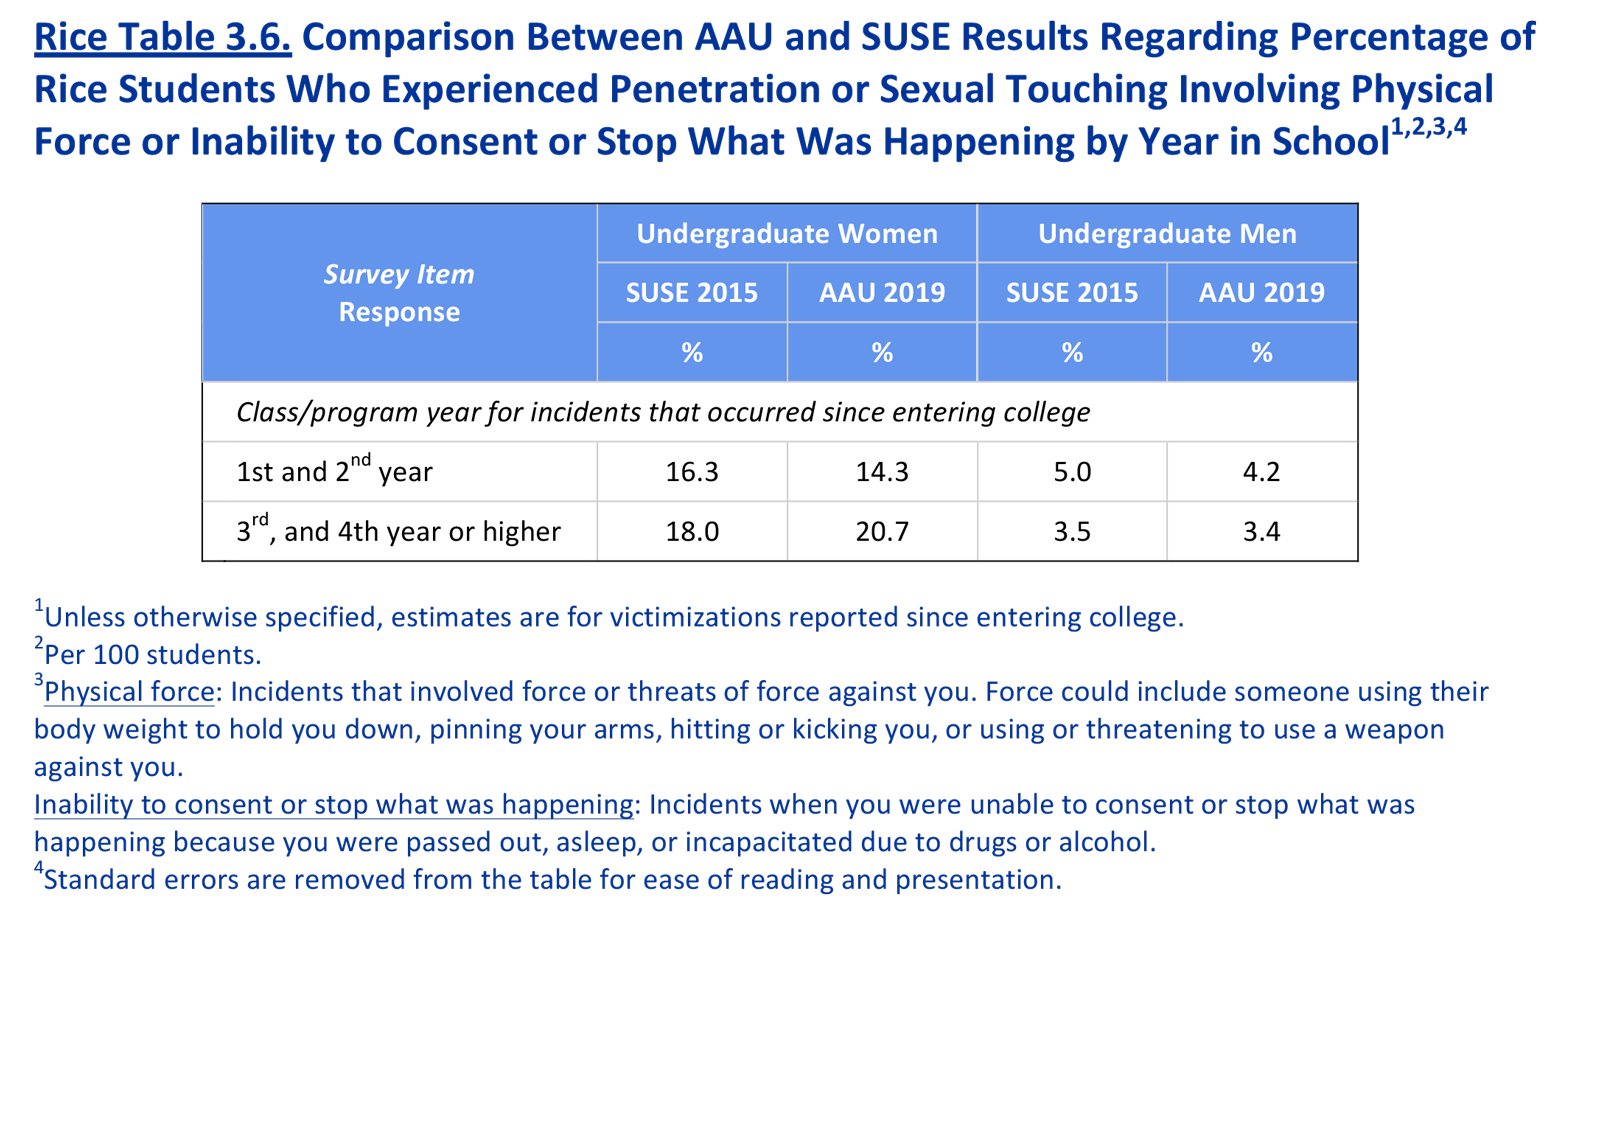
With these caveats in mind, in Table 3.6 we have compared the 2019 AAU and 2015 SUSE Rice results regarding the percentage of Rice undergraduate students who experienced penetration or sexual touching involving physical force or inability to consent or stop what was happening by year in school. In the table, we present separate rates for (a) first and second year students, and (b) third and higher year students because, in 2015, first and second year students in SUSE had not been exposed to any of the new programming and resources involving sexual violence prevention and support, healthy relationships and consent, but in the 2019 AAU, first and second year students had been exposed to all of this new programming.
Looking at Table 3.6, it shows a decrease among first and second year undergraduate students between 2015 and 2019 among women (2015: 16.3%, 2019: 14.3%) and men (2015: 5.0%, 2019: 4.2%). Among third and higher year students, however, we do not see this decrease. A key difference for these two cohorts was the introduction of Rice’s Critical Topics in Sexuality (CTIS) workshop, which has been required for all first-year students since the 2017 matriculating cohort.
What has changed at Rice since administration of the Survey on Unwanted Sexual Experiences in 2015?
- Most notably, students asked for the creation of a class, required of all undergraduates, that would be devoted to education about sexual violence prevention and support, healthy relationships and consent. As a result, The CTIS Workshops were created and implemented beginning in fall 2017; also created was an optional, semester-long LPAP that addresses many other related topics.
- The SAFE Office: Interpersonal Misconduct Prevention and Support (formerly Office of Sexual Violence Prevention and Title IX Support) was expanded to include a third professional staff member. SAFE Office services were also enhanced to include assistance with Crime Victims Compensation and post-assault forensic exams, and office staff developed a new set of targeted trainings for faculty, staff and students. Finally, in Fall 2019, the SAFE Office was relocated to enhance confidentiality and facilitate collaboration with Student Health Services.
- Students Transforming Rice Into a Violence-Free Environment (STRIVE) has been fully implemented with over 30 undergraduate and graduate liaisons on campus trained to assist students with access to on and off-campus resources.
- The Montrose Center, a LGBTQI specific community center, entered a formal relationship with Rice as a community partner. Center staff routinely offer training for Rice students and staff.
- The SAFE Office developed a list of targeted trainings that are hosted in the magister’s houses and individual sessions of the CTIS workshops are also offered in these series.
- Rice has partnered with the nonprofit Texas Forensic Nurse Examiners to provide forensic kits on campus, which can be accessed by calling the SAFE Office: 713-348-3311 or RUPD: 713-348-6000.
[1] This question asked respondents about a unique set of resources and offices at their respective institutions; accordingly, there is no aggregate data for comparison.

